How do District Admins view Usage Reports by subject?
 Updated
by
Gayle McKee
Updated
by
Gayle McKee
District Administrators can use the Usage Report by Subject to easily view which subjects are being used the most or the least in the district. They can also see detailed usage information regarding what types of activities the students have been working on in Progress Learning and the time spent on these activities.
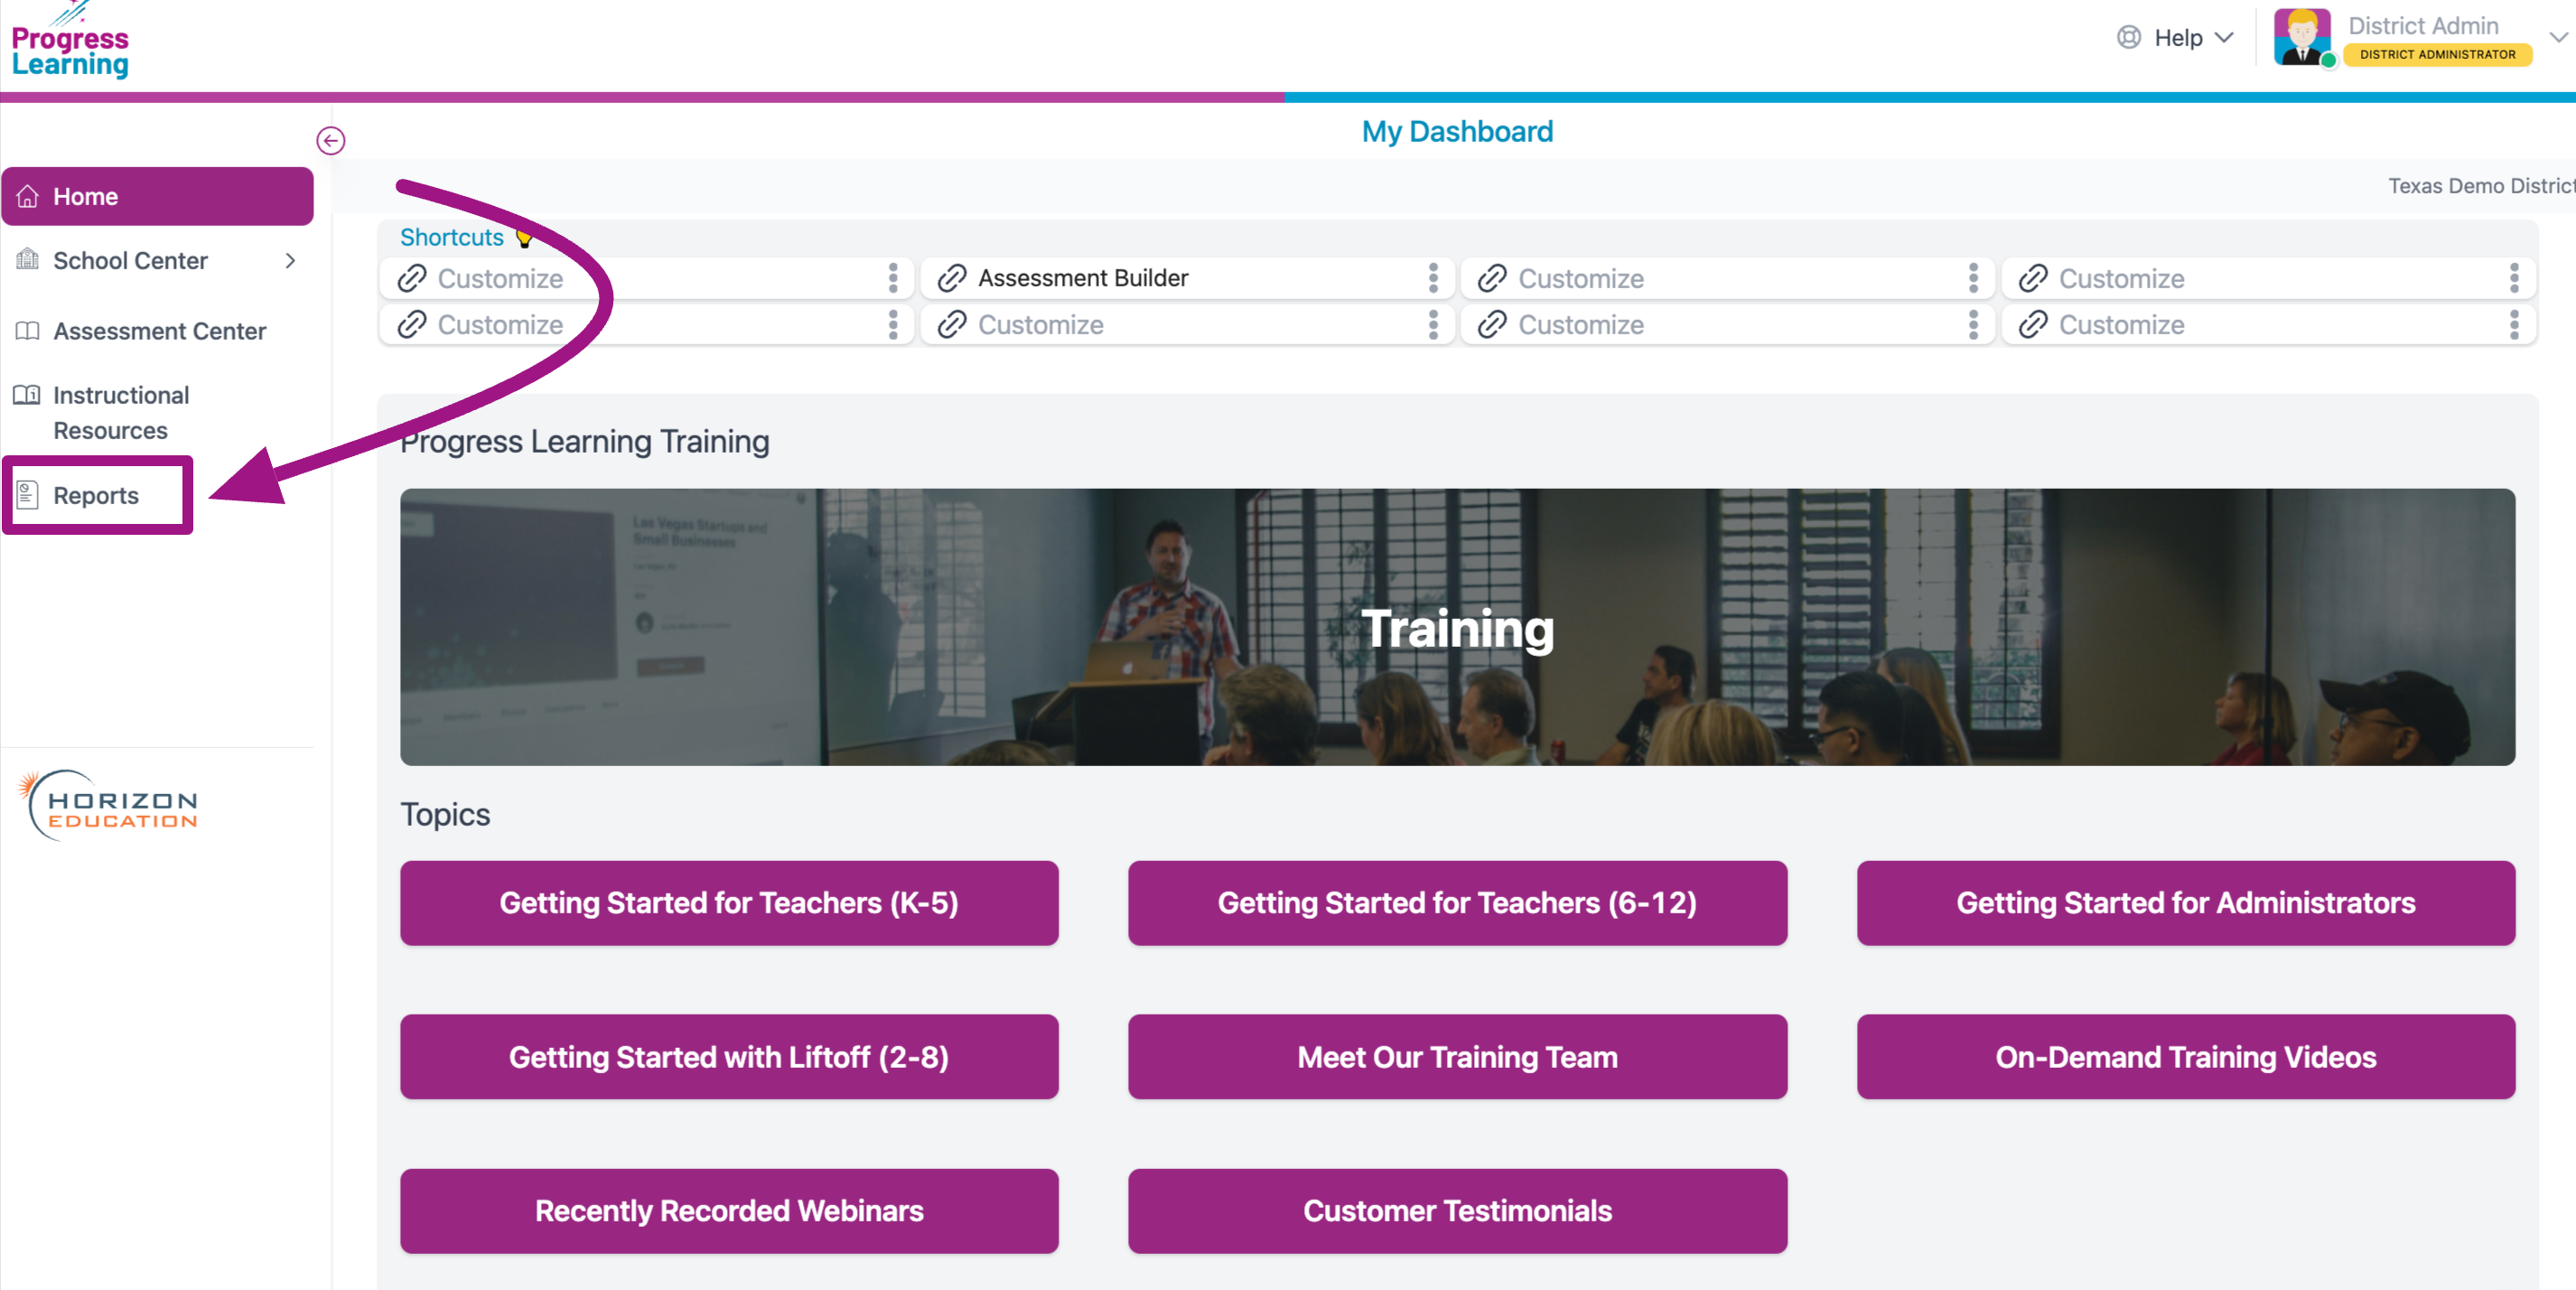
- From the home screen of your District Admin dashboard, click on the Reports icon in the navigation menu on the left side of the screen.
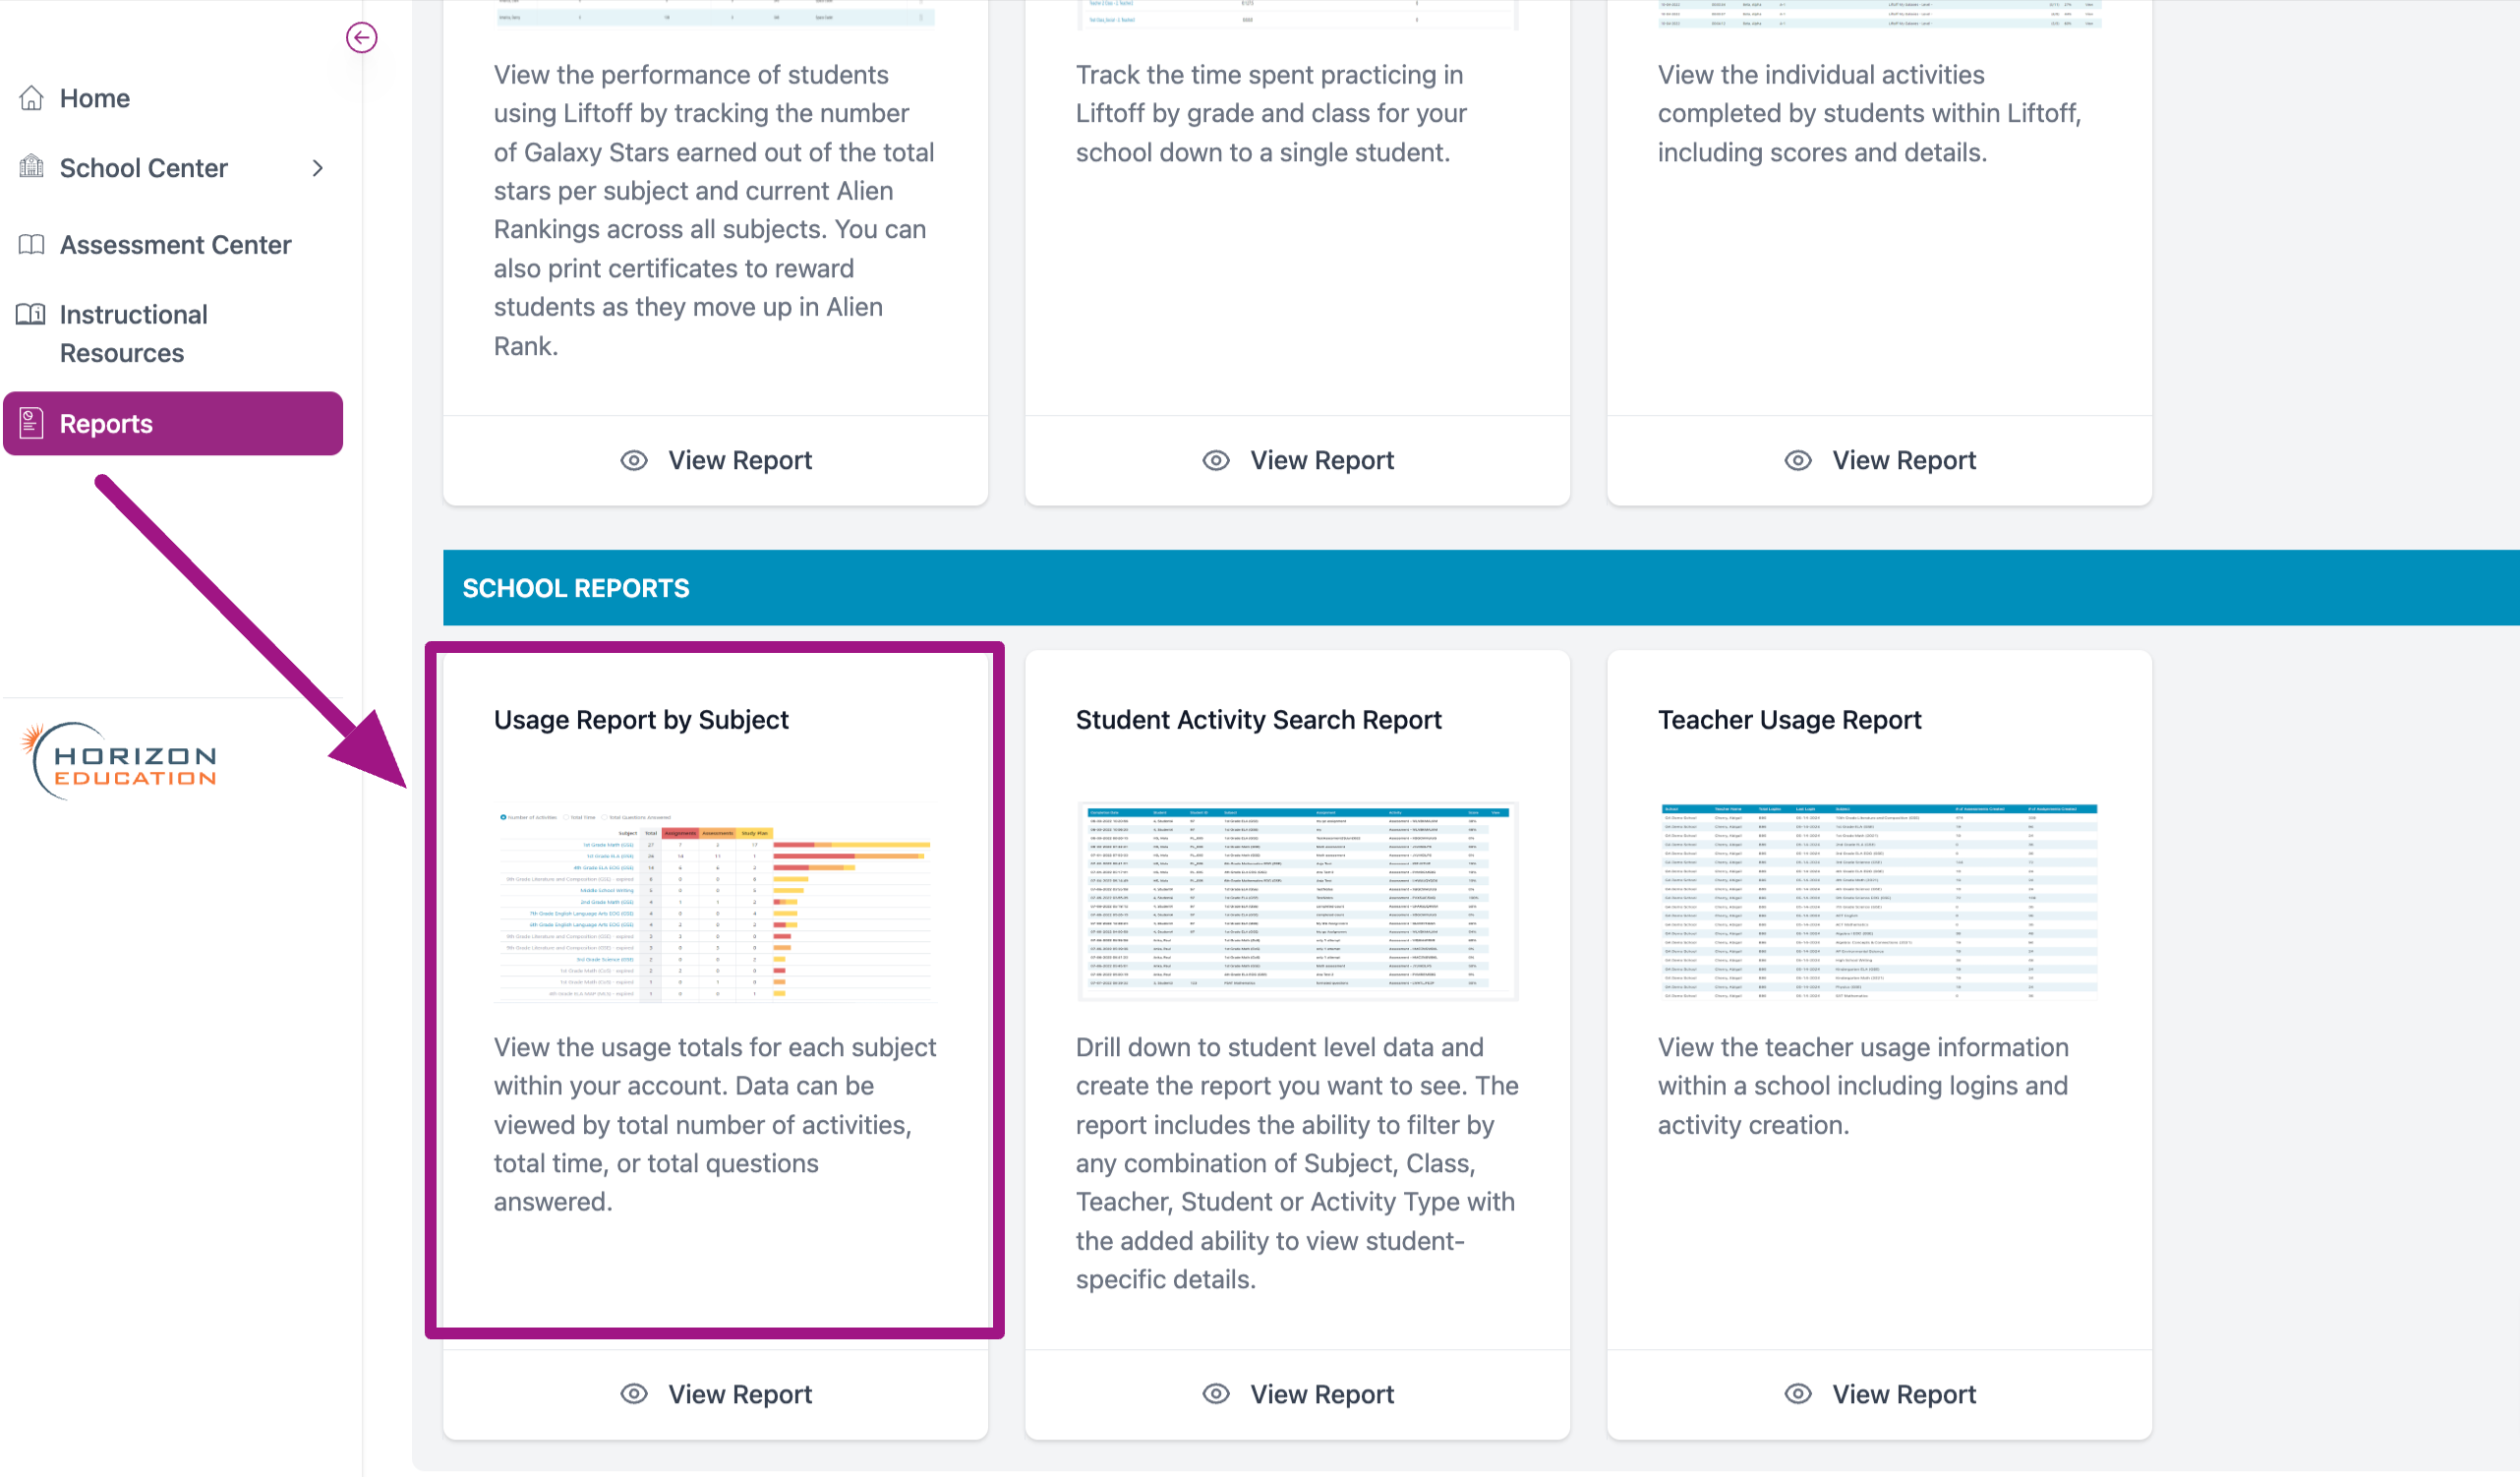
- Scroll to the bottom of the page and click Usage Report by Subject in the School Reports section.
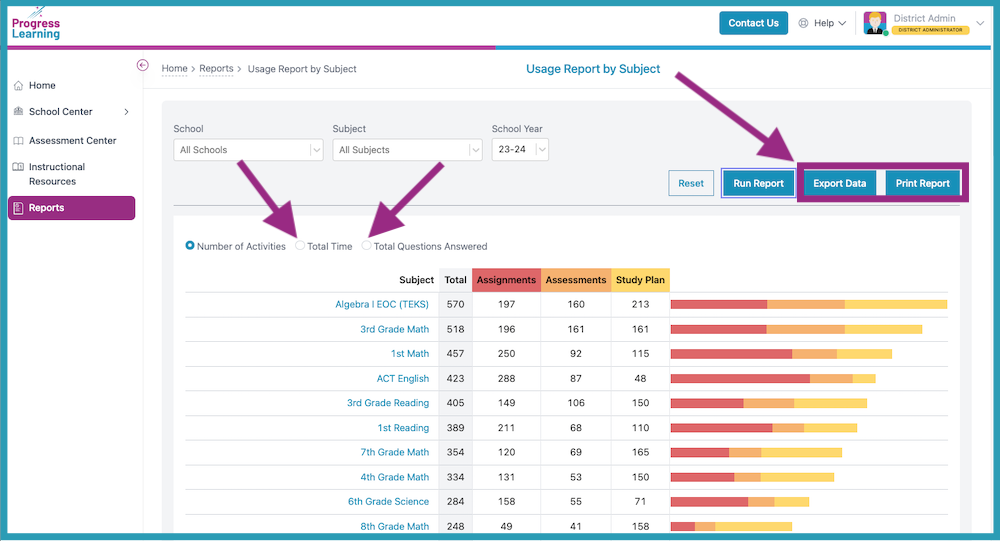
- Using the filter, you can select to see usage data for a single school or cumulative usage for multiple schools. You can also select a single subject or multiple subjects. To see an overall list of which subjects are being used from most to least across the entire district, select All Schools and click Run Report. You can also Export this report or Export by School.
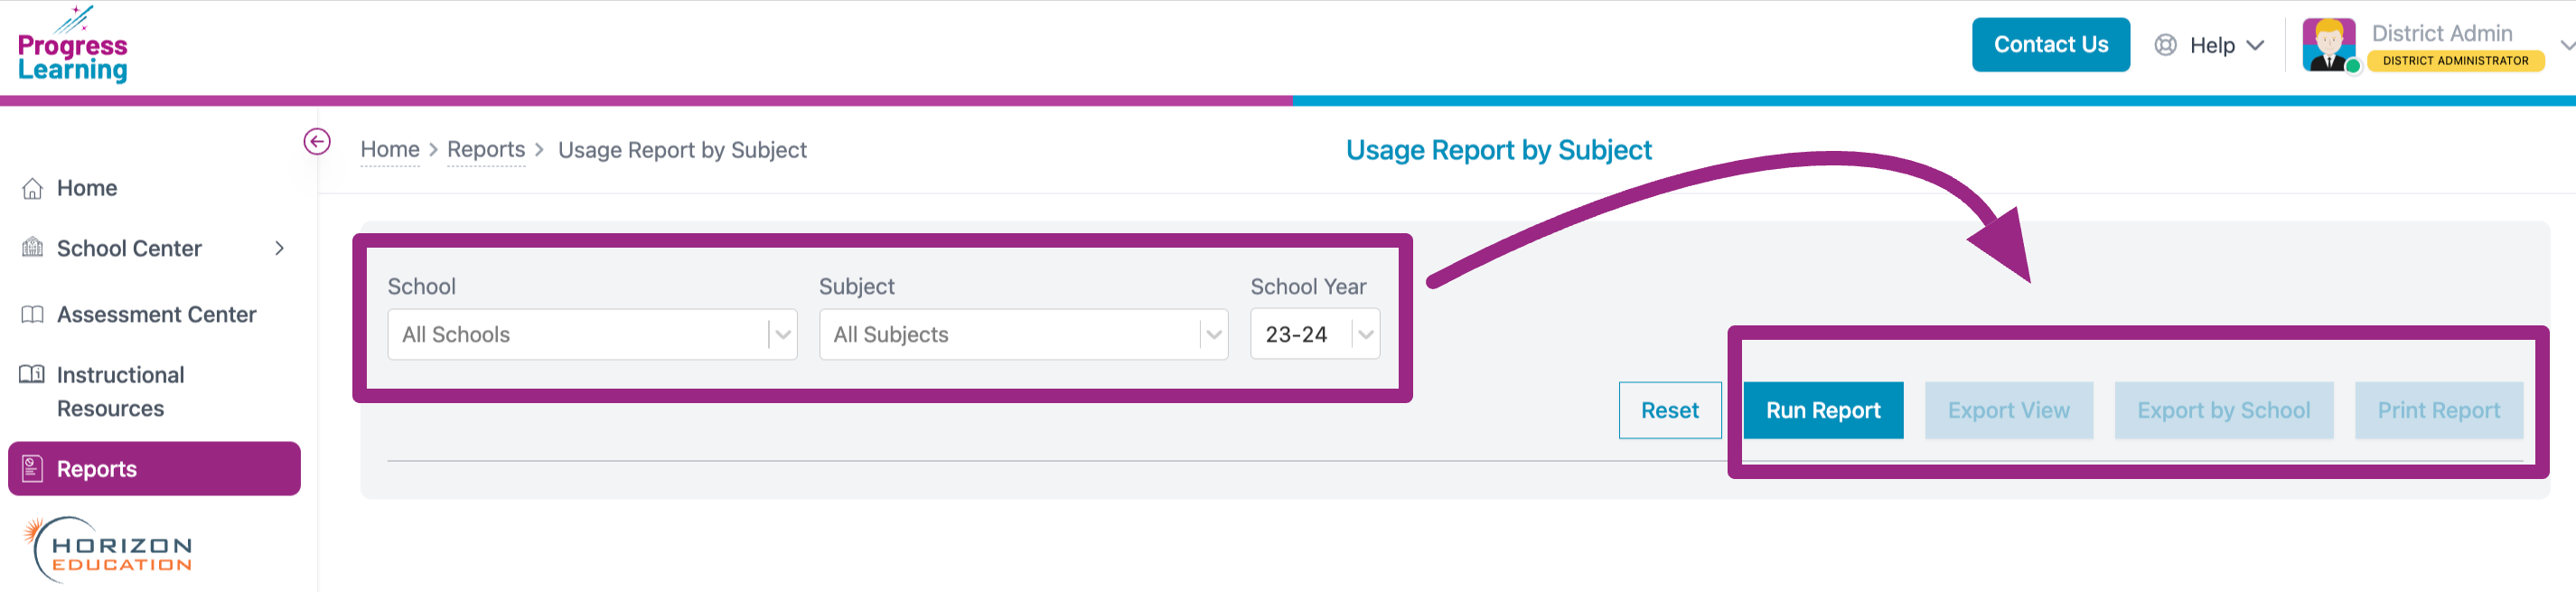
Please note that the report may take a few seconds longer to load if there is a large volume of student and teacher data to be generated in the report.
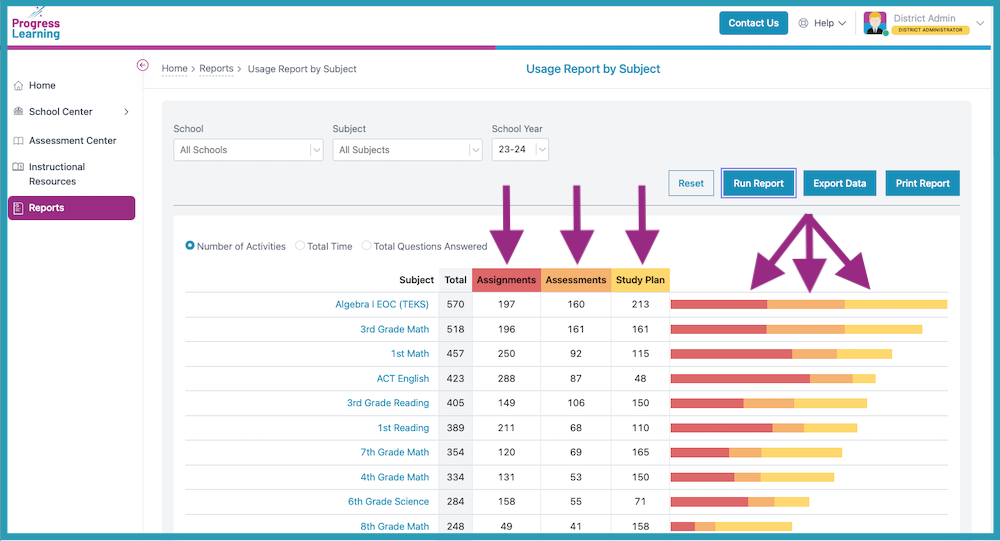
- By default, the Usage Report will show the total number of activities completed for each subject. You will see the total number of Assignments, Assessments, and Study Plan activities completed in the bar graph. The list will appear in descending order from the most used subjects to the least used subjects.
Tip: To boost engagement with any subjects that may be under utilized, make sure all teachers know that this resource is available to them and have them attend a "Getting Started" training. Visit our Live Training Calendar to register for free training.
- Report Options: You can also choose to see the same report based on the total time spent on activities or by the total number of questions answered. You also have the option to export the data to Excel or print the report.