What types of reports are available for teachers?
 Updated
by
Gayle McKee
Updated
by
Gayle McKee
- Progress Monitoring Reports
- Progress Report
- Performance Report
- Student Report Card
- Gradebook Report
- Galaxy Star Report (*K-5 Only)
- Session Activity Report
- Assessment Comparison Report
- Student Diagnostic Strengths and Weaknesses (Texas teachers only)
- Results Report(Assessment View)
- Results Report(Assignment View)
- Export Assessment Results Report
- Usage Report by Subject
Progress Monitoring Reports
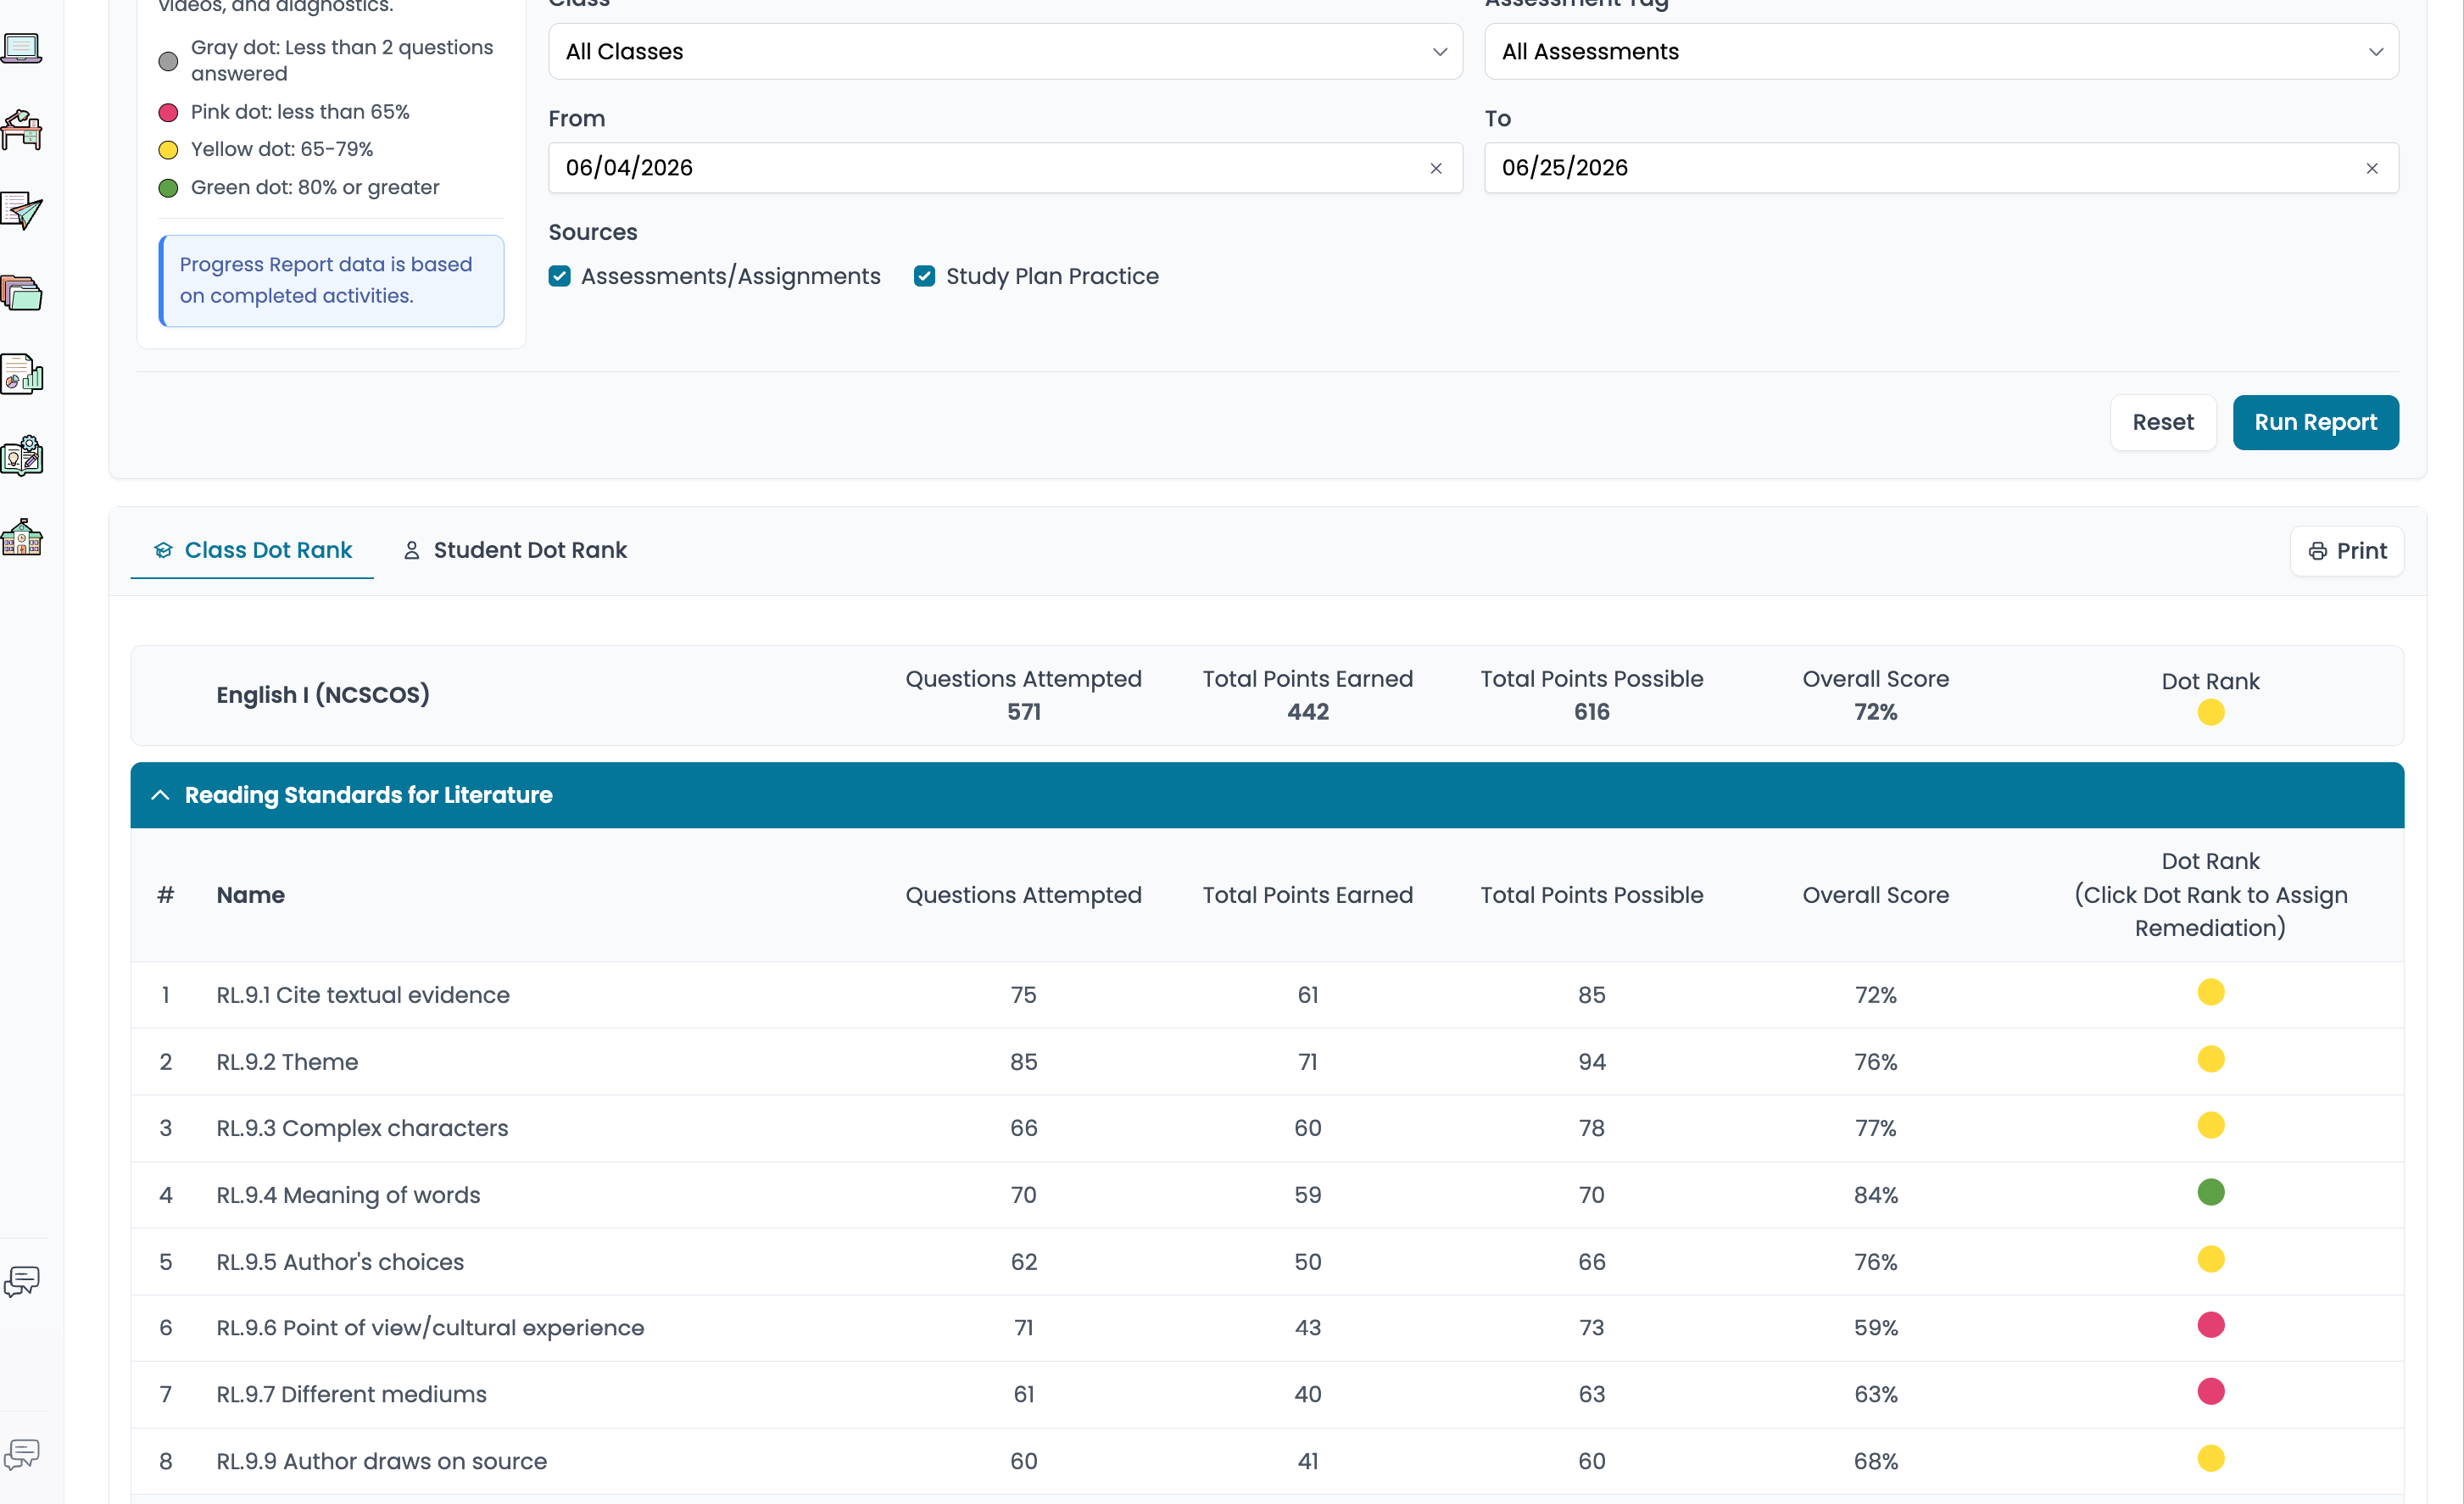
Progress Report
- Where to find it? There are two ways to access a Progress Report:
- Reports menu (click on Reports from the side menu bar and select the Progress Report).
- Select the subject and any additional desired filters.
- What data is displayed? See how students are progressing in a specific subject area in real-time with the color-coded dot rank system. The cumulative data is broken down by Standard, and the report can be filtered by class, date range, and by source. View class averages or student averages by navigating between the "Class Dot Rank Tab" and the "Student Dot Rank Tab". Click on a student's name to pull an individual student progress report. **Admins can see school-wide progress reports by teacher and class.
- Exportable or Printable? Printable
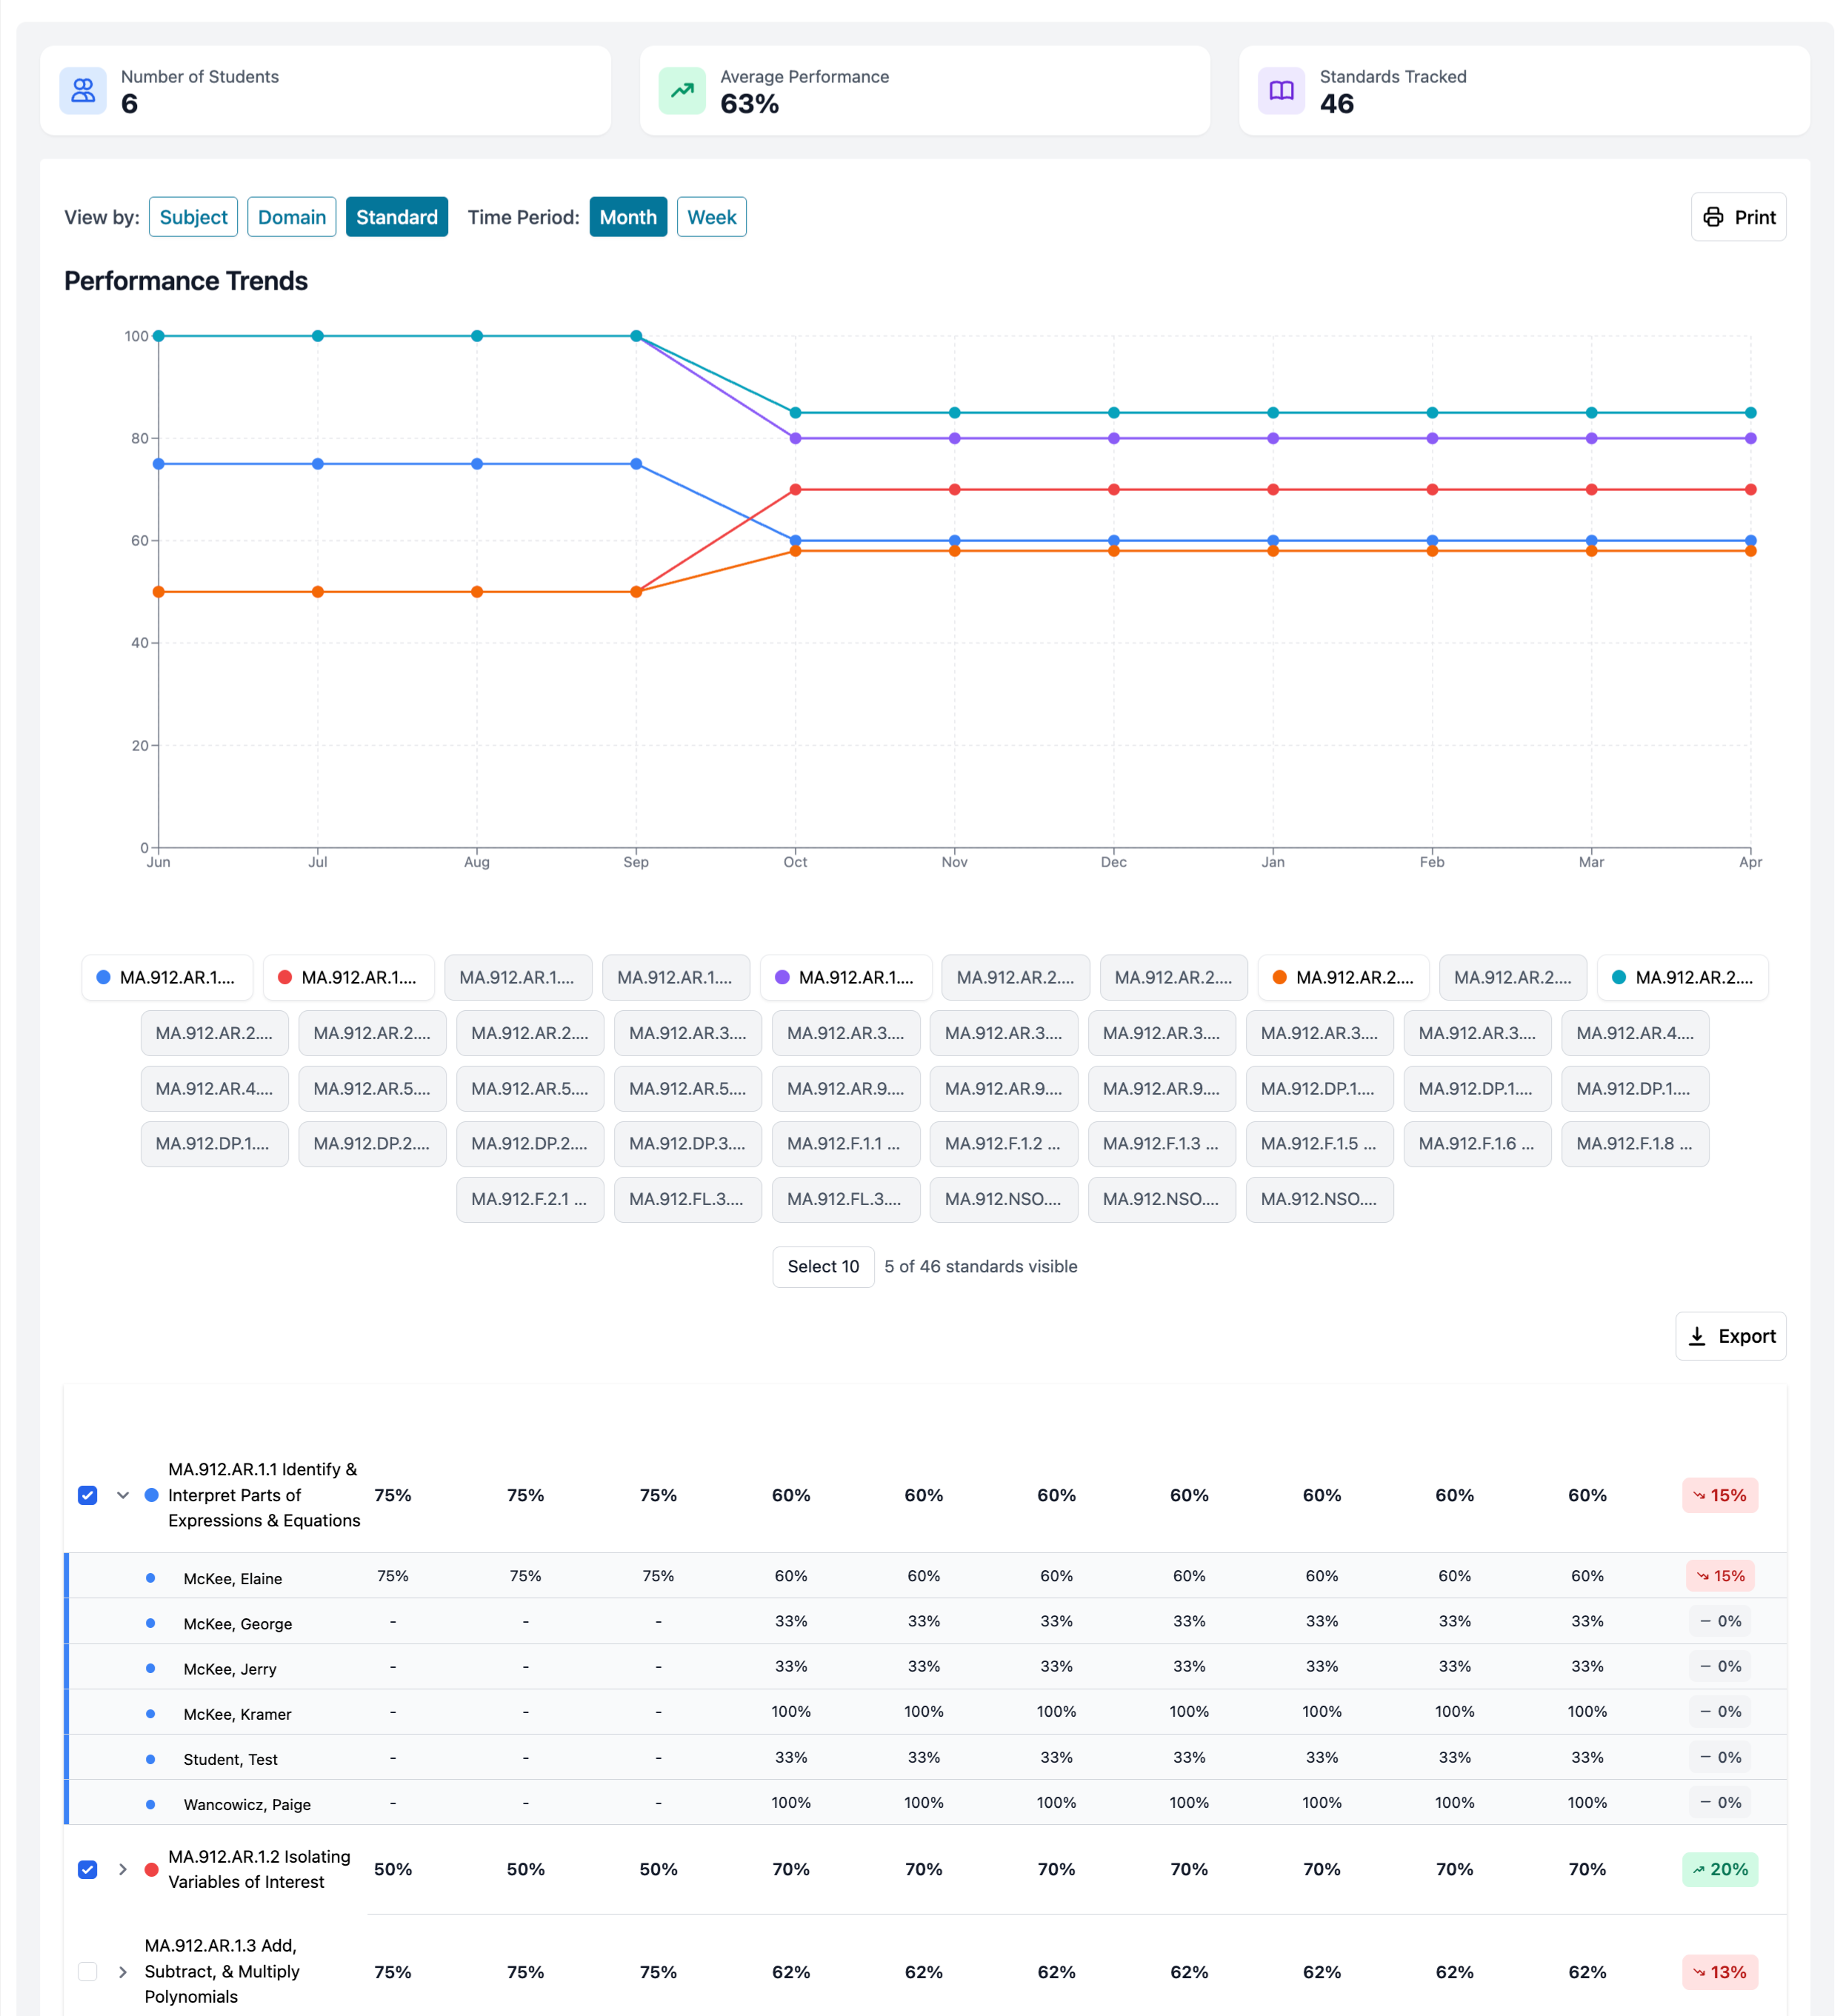
Performance Report
- Where to find it?
- Reports menu (click on Reports from the side menu bar and select the Performance Report).
- What data is displayed?
- View Student performance trends and key metrics by subject, domain and standard.
- Exportable or Printable? Printable
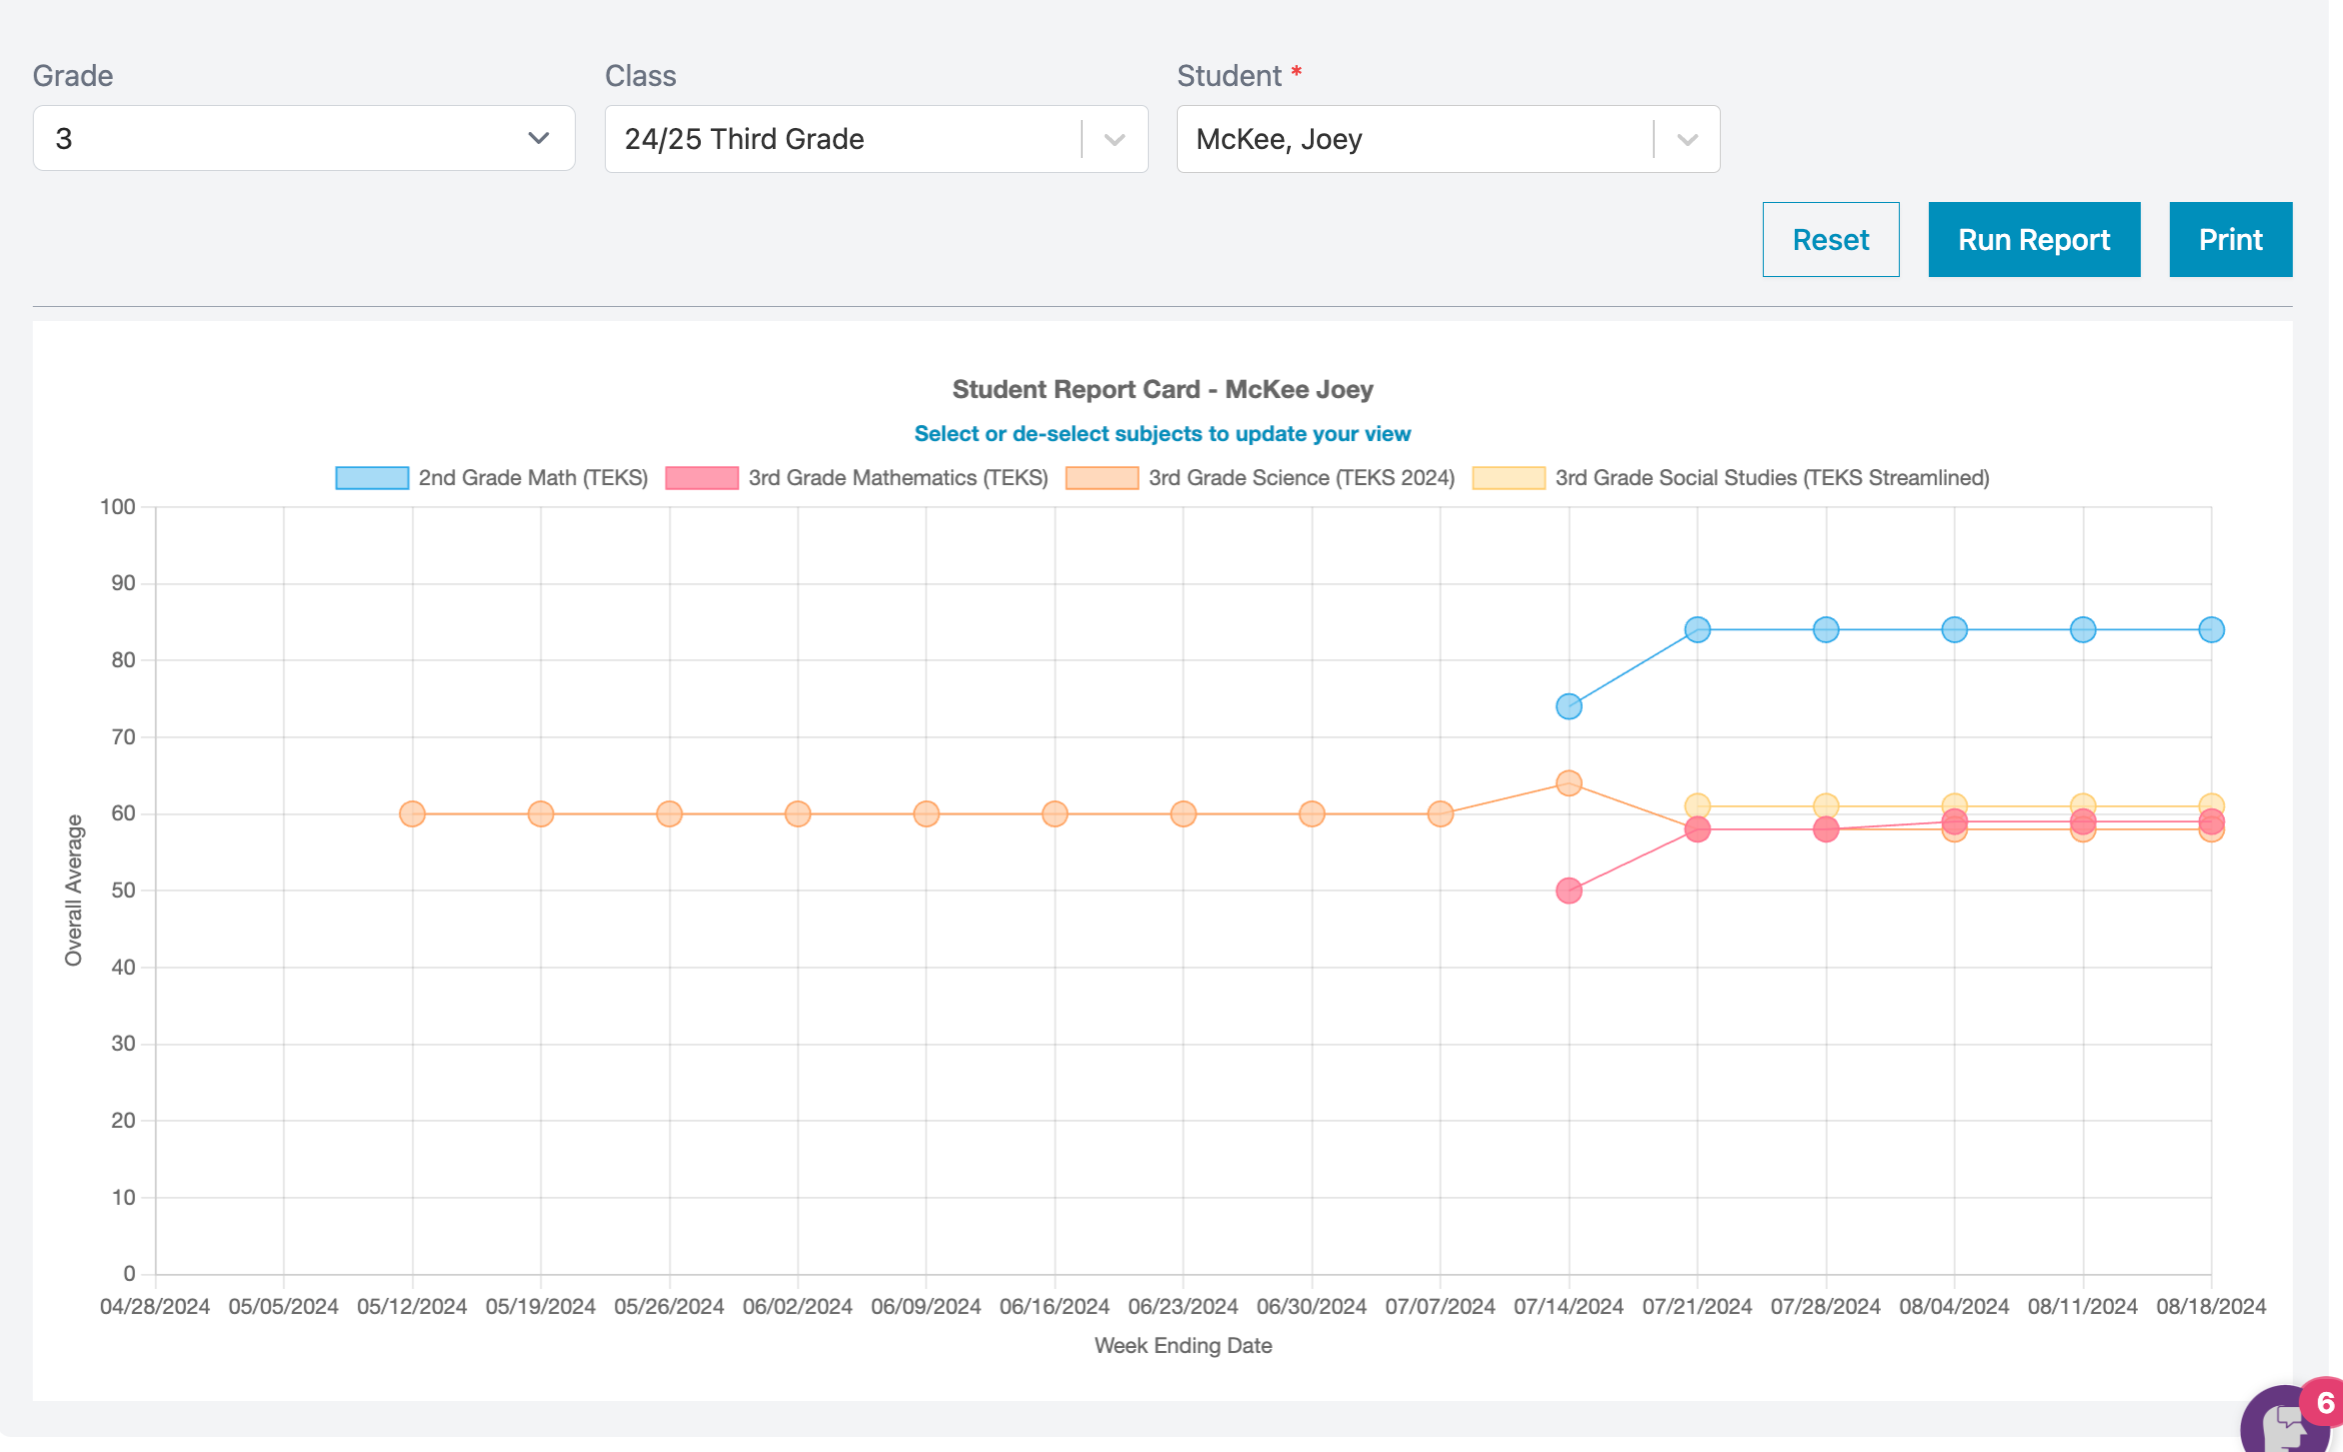
Student Report Card
- Where to find it?
- Reports menu (click on Reports from the side menu bar and select the Student Report Card).
- Click on "Reports" in the side navigation menu and then click on "Student Report Card."
- What data is displayed?
- The report allows you to analyze student results over time by subject. The graph is interactive. Click on the subject in the key at the top to hide or unhide that subject.
- Exportable or Printable? Printable
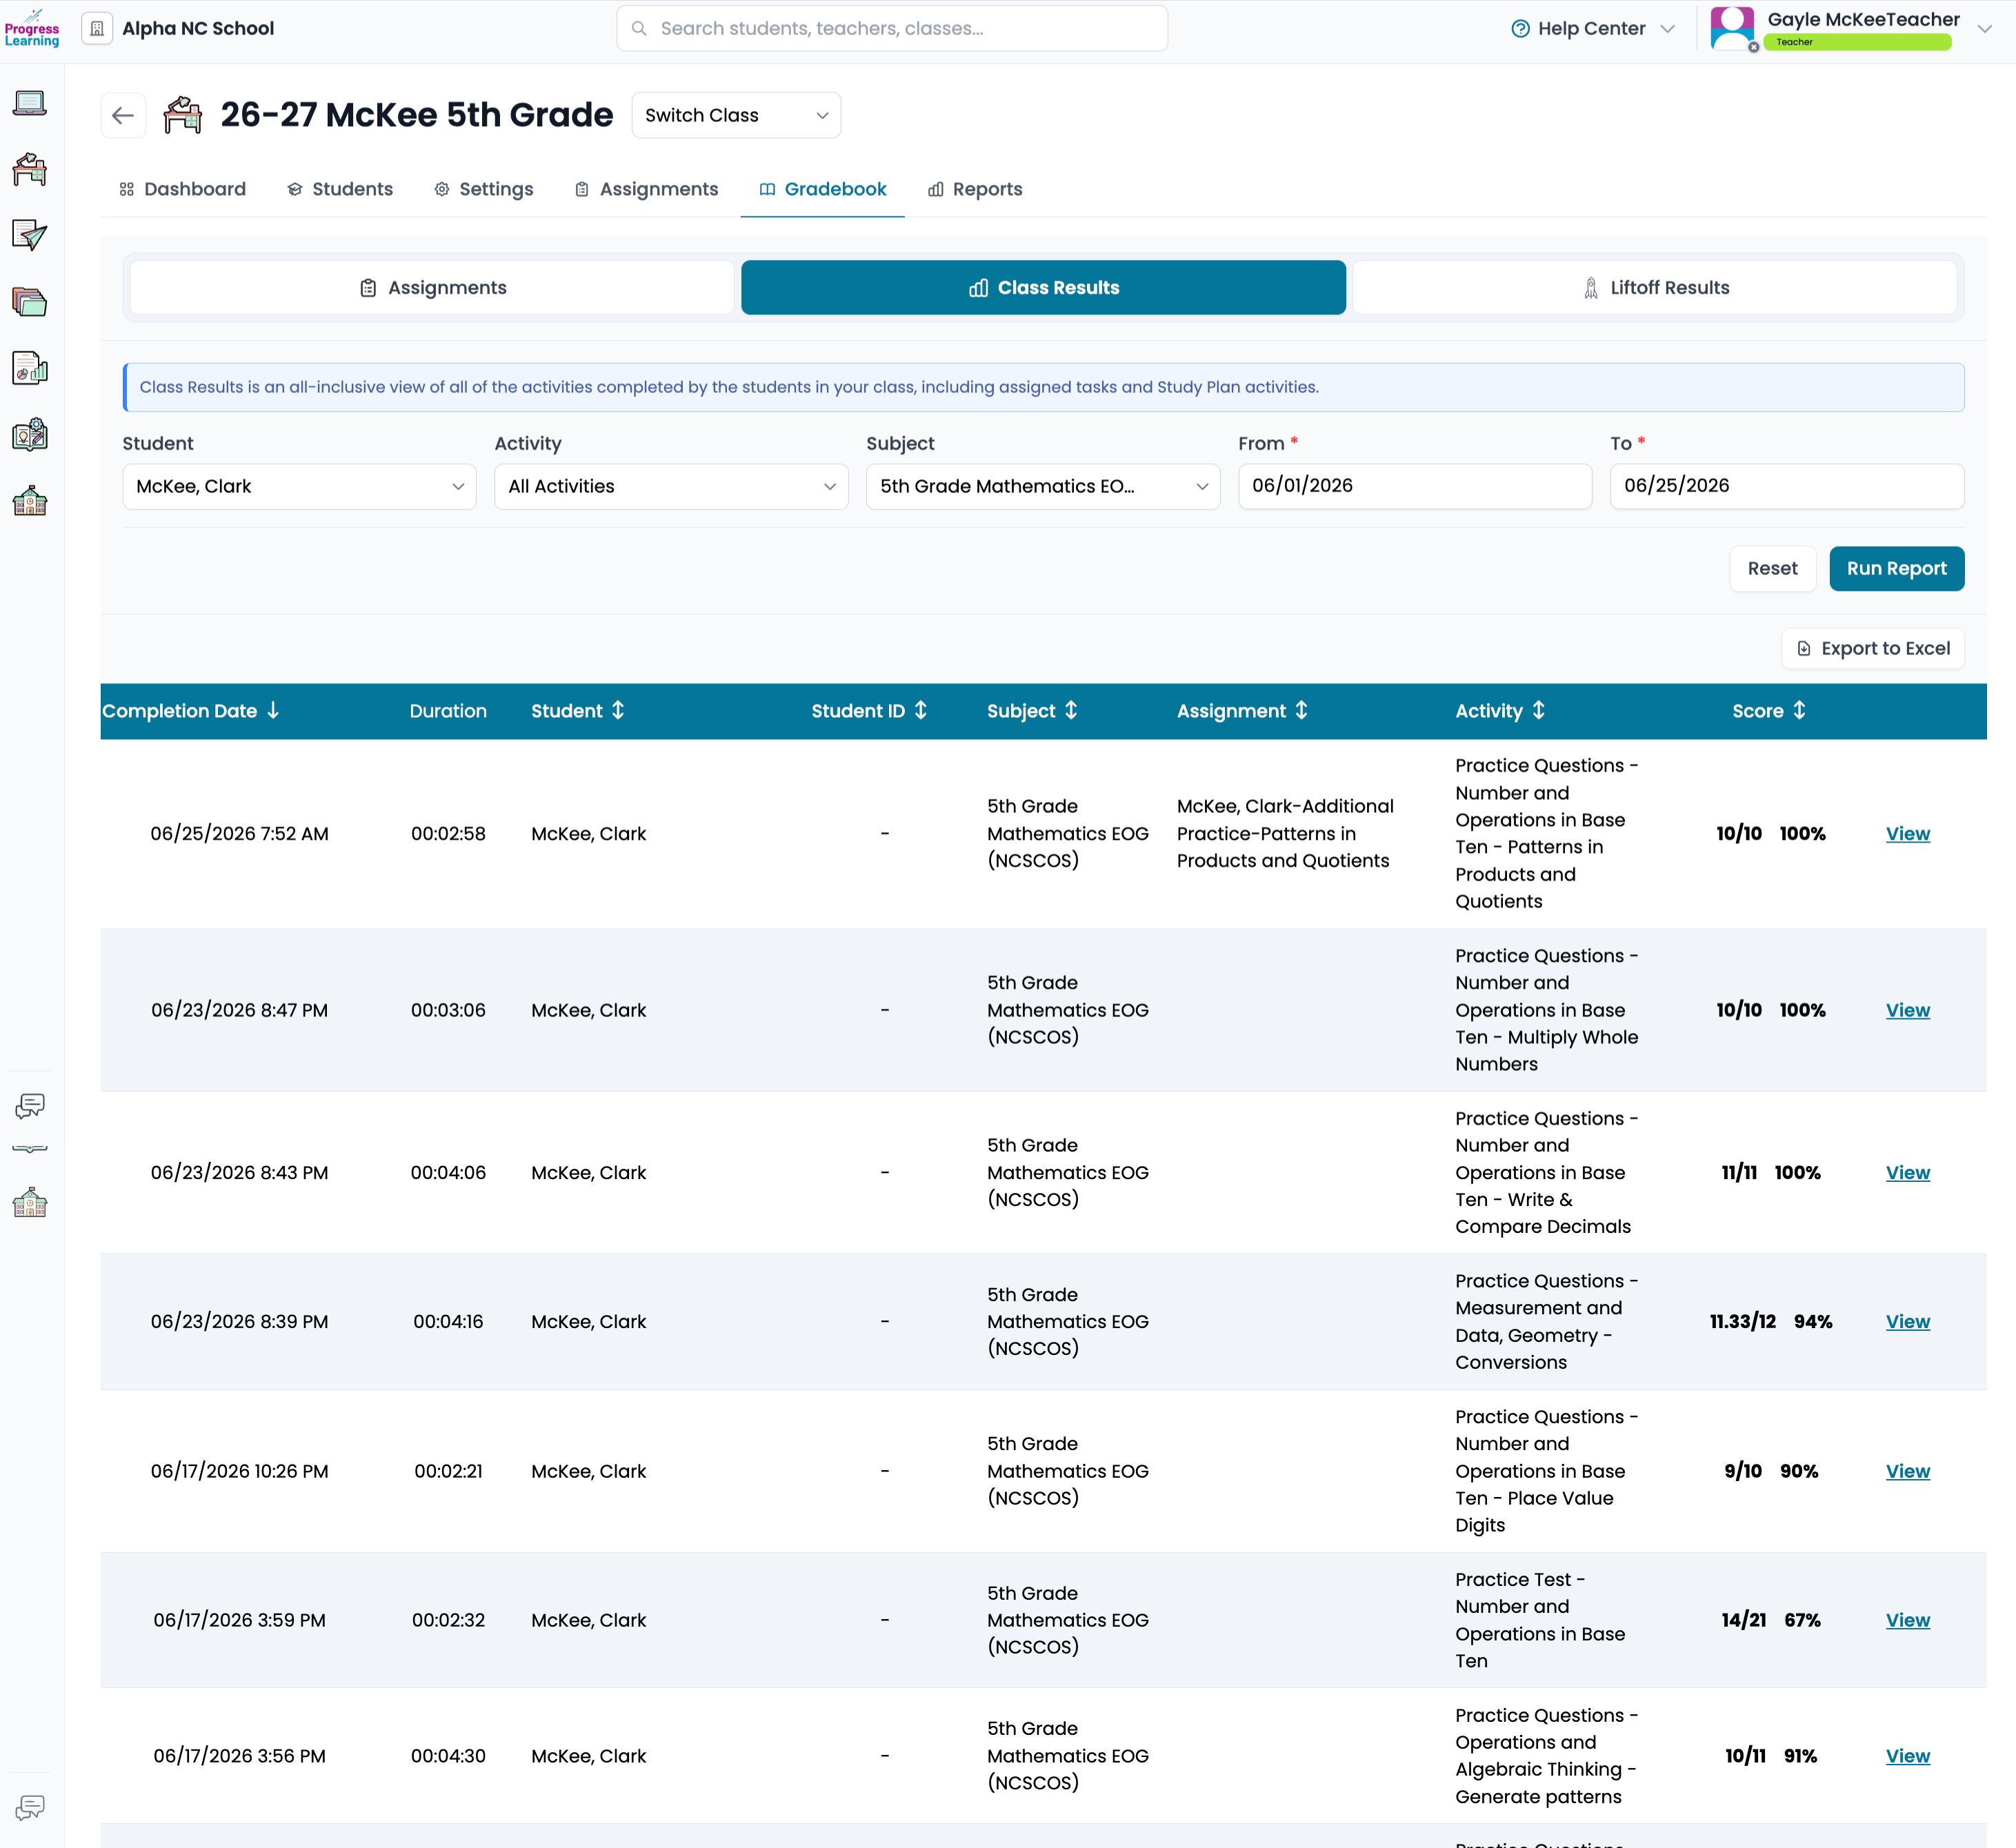
Gradebook Report
- Where to find it?
- Reports menu (click on Reports from the side menu bar and select the Gradebook Report).
- What data is displayed? In the first tab, track results for assessments and assignments in a grade book style view. Class Results is an all-inclusive view of all of the activities completed by the students in your class. It will show all results; even if there are multiple attempts for a single student, you can view each individual attempt. Based on the subjects associated with the class, this will show all results for both assigned activities and independent practice for each student in the class.
- Teachers can also view the individual activities completed by students within Liftoff, including scores and details.
- Exportable or Printable? Exportable
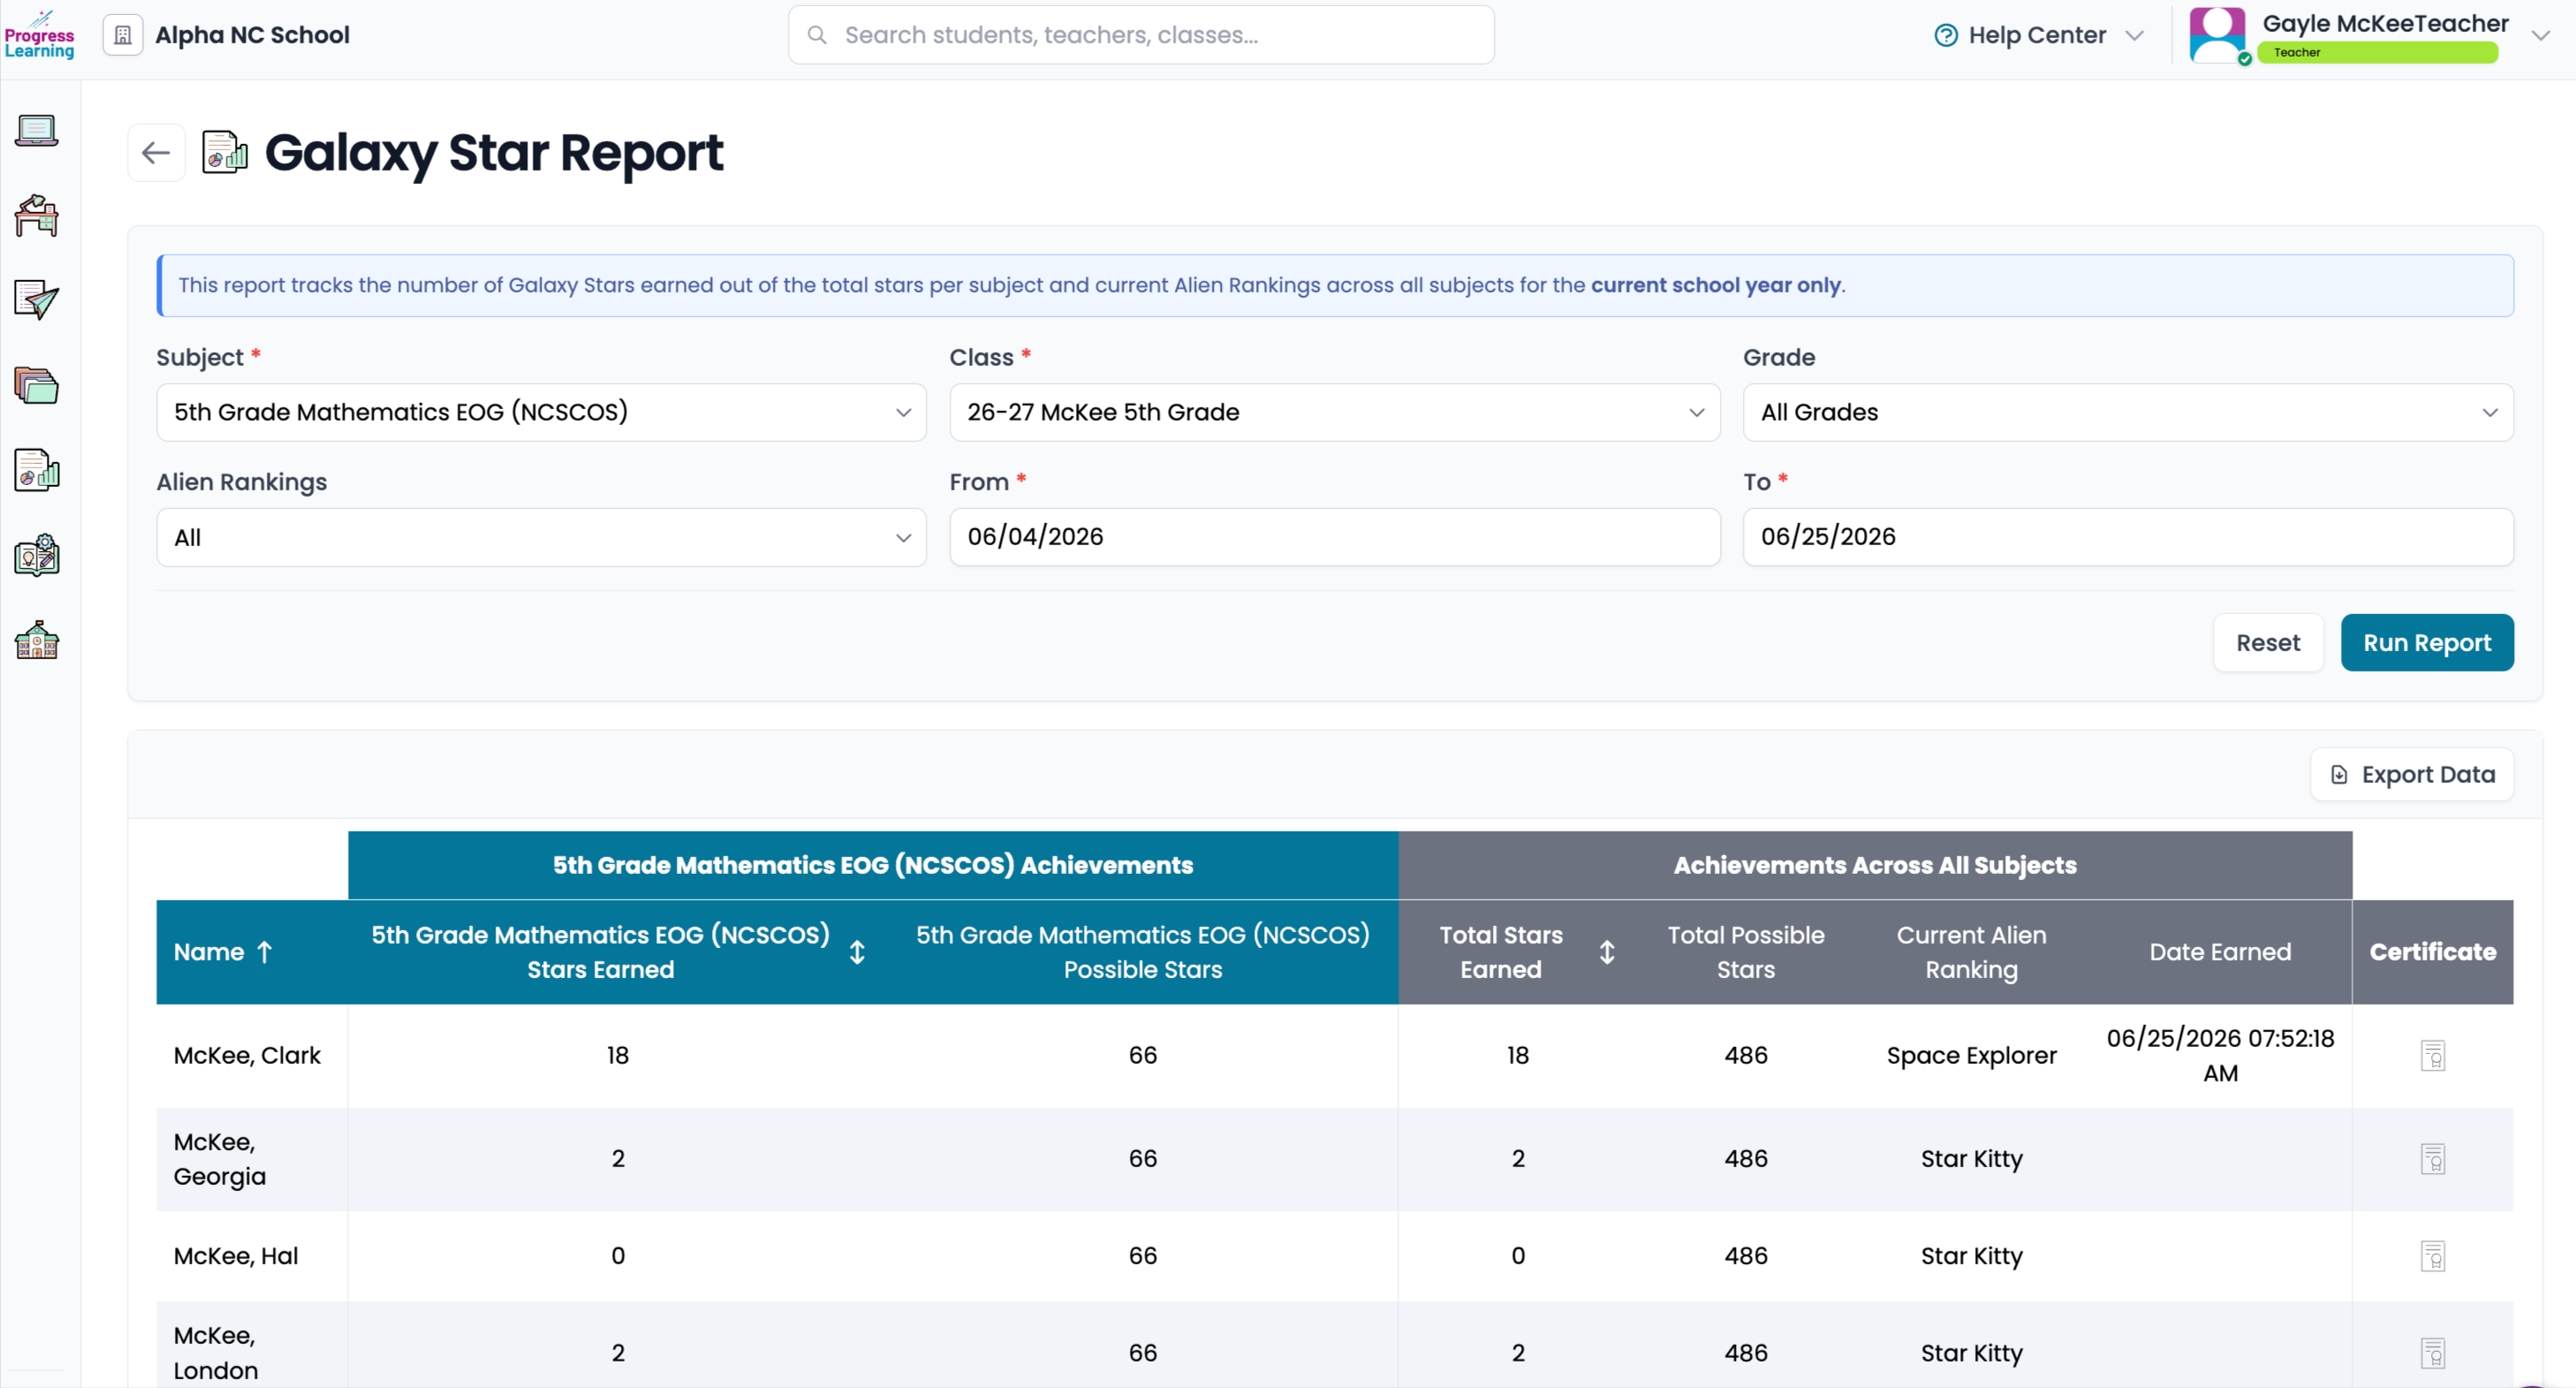
Galaxy Star Report (*K-5 Only)
- Where to find it?
- Reports menu (click on Reports from the side menu bar and select the Galaxy Star Report).
- What data is displayed? See how many Galaxy Stars students in Grades K-5 have earned on Progress Learning per selected subject and overall in all subjects.
- Teachers can also see a student's current Alien Ranking and download a certificate to reward students for improving their ranking. **This report does not include Galaxy Stars earned in Liftoff.
- Exportable or Printable? Exportable, and the Student Certificates are printable.
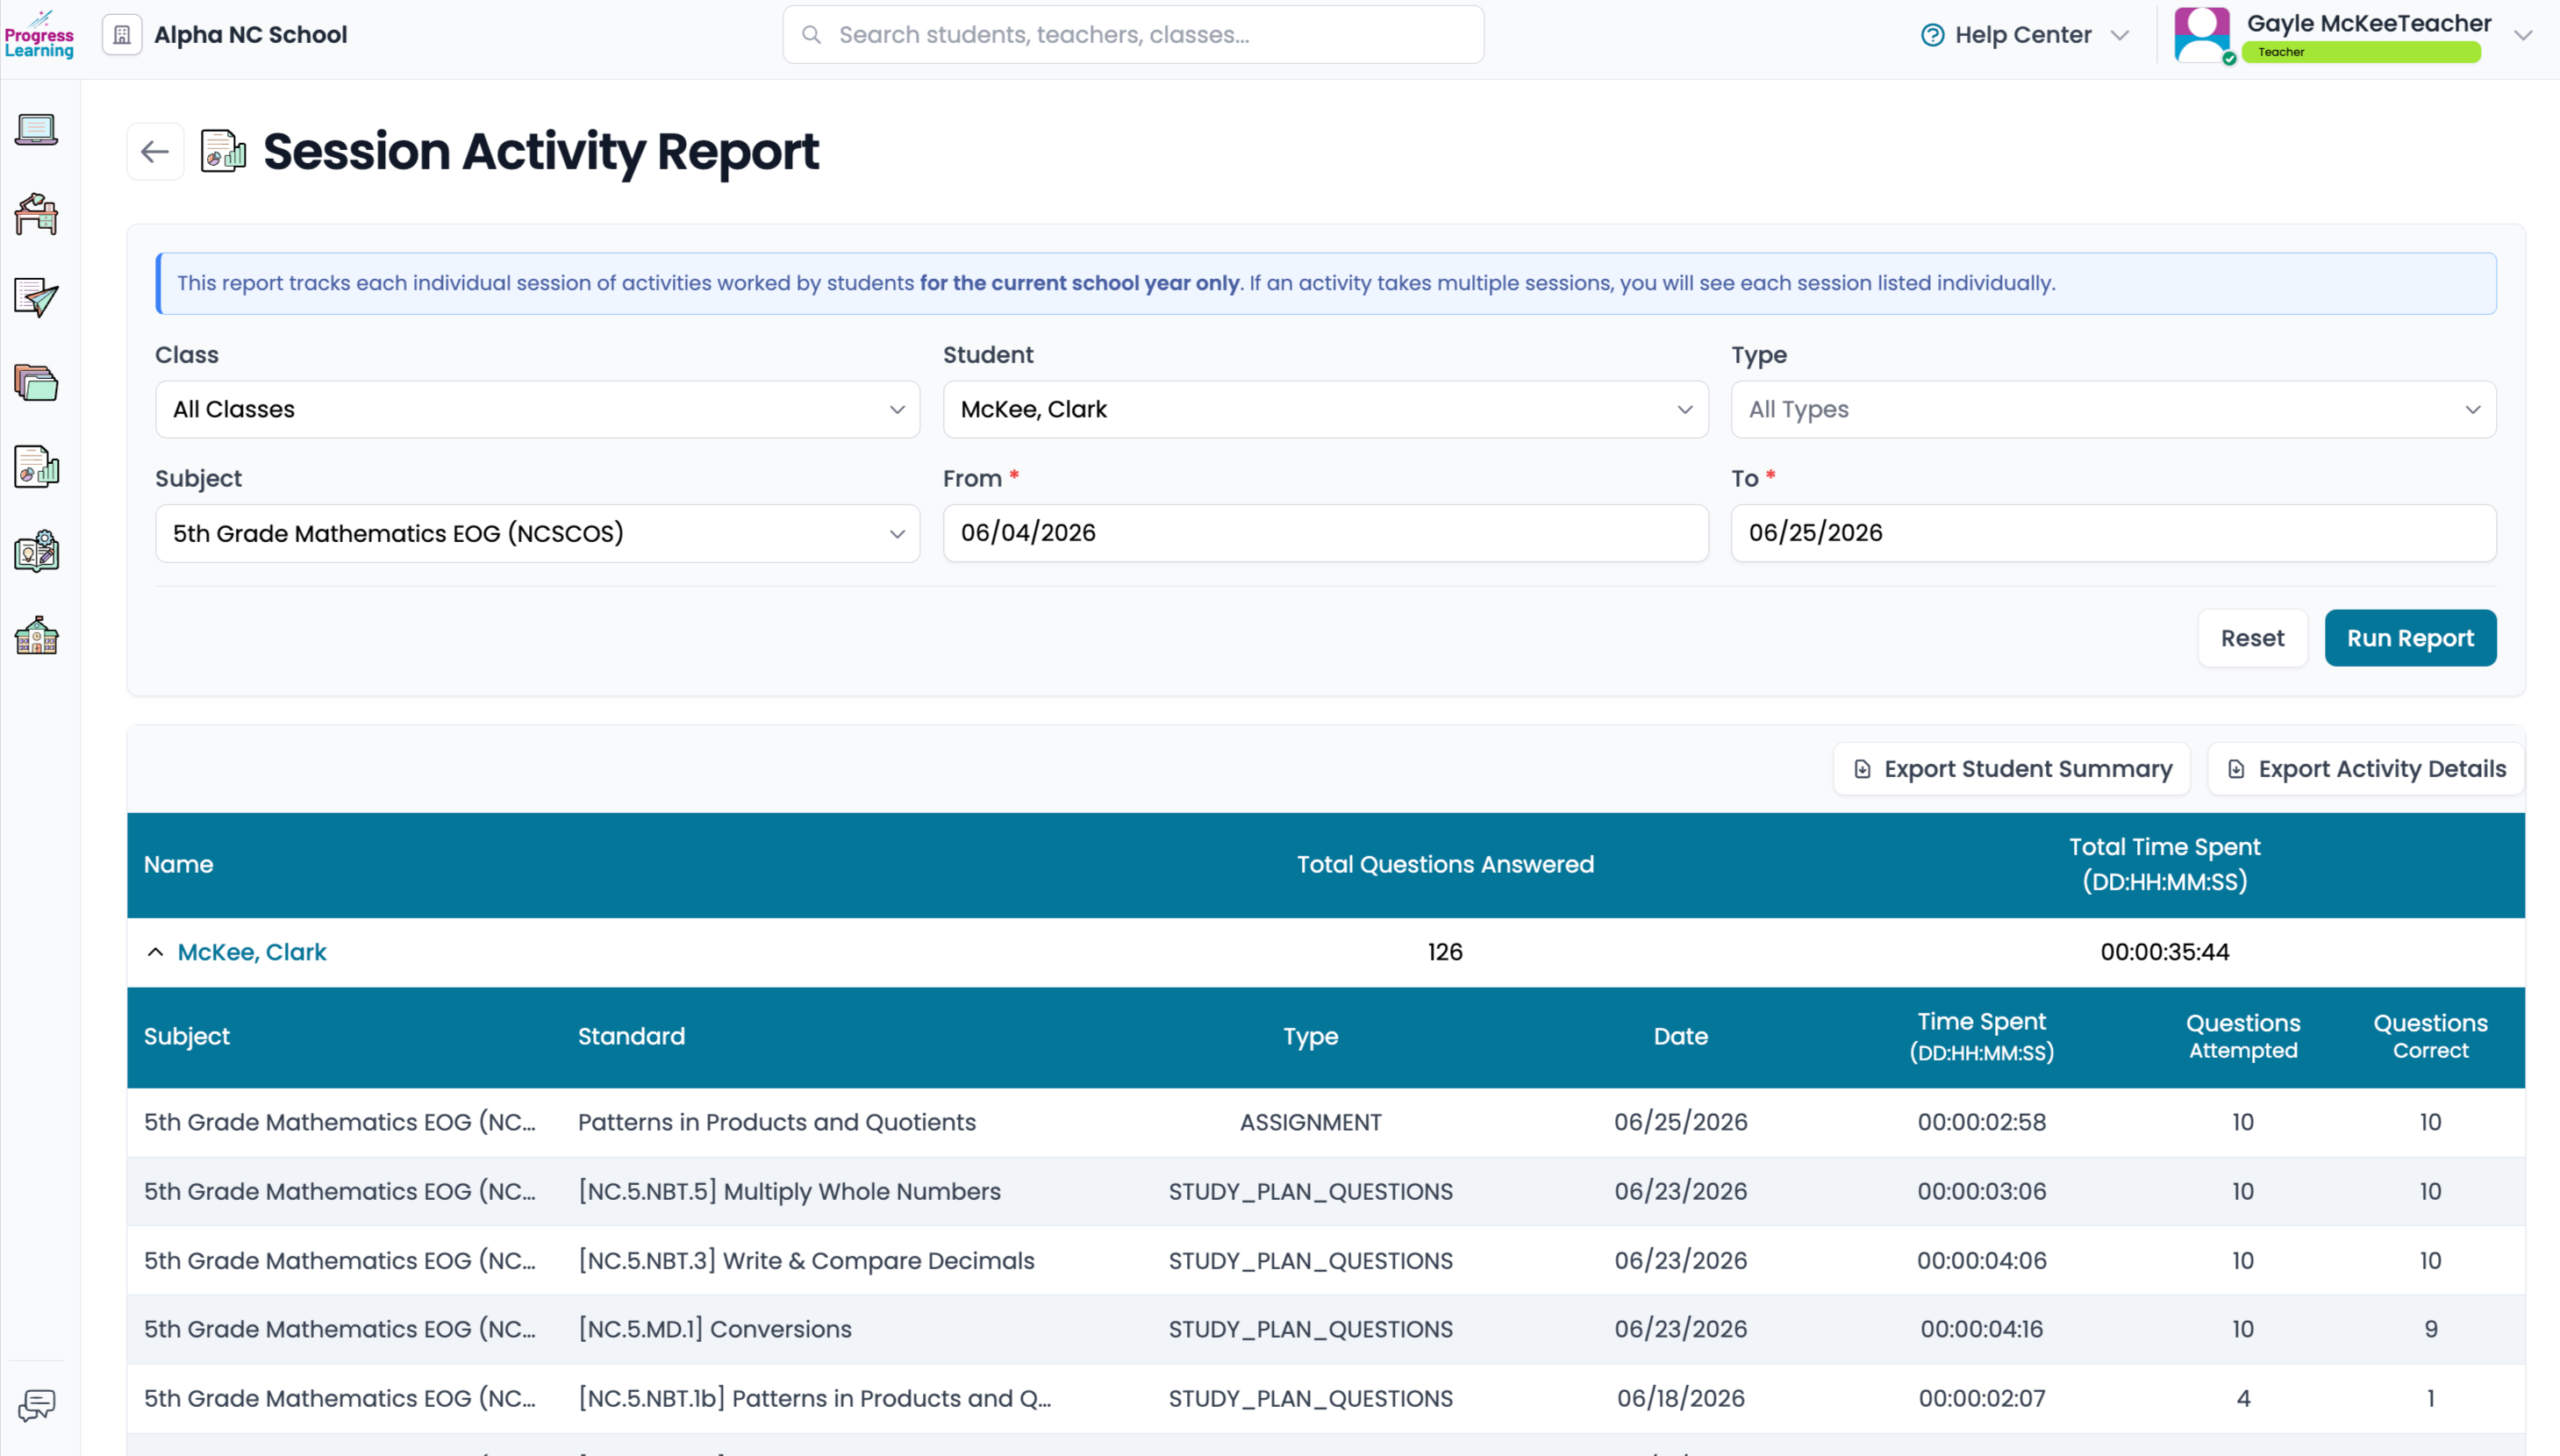
Session Activity Report
- Where to find it?
- Reports menu (click on Reports from the side menu bar and select the Session Activity Report).
- What data is displayed? Teachers can see the overall usage for each student at a glance. Click on the ⌄ symbol next to a student's name to see more detailed information. Teachers can track the subject, standard, activity type, date, time spent, number of questions answered, and the number of questions correct for every session. When you export the Activity Details report, in the "class" column, assigned activities are labeled with the specific class name. If the "class" column is blank, that activity was done independently in the study plan, and is not associated with a class.
- Exportable or Printable? Export the Student Summary and/or the Activity Details
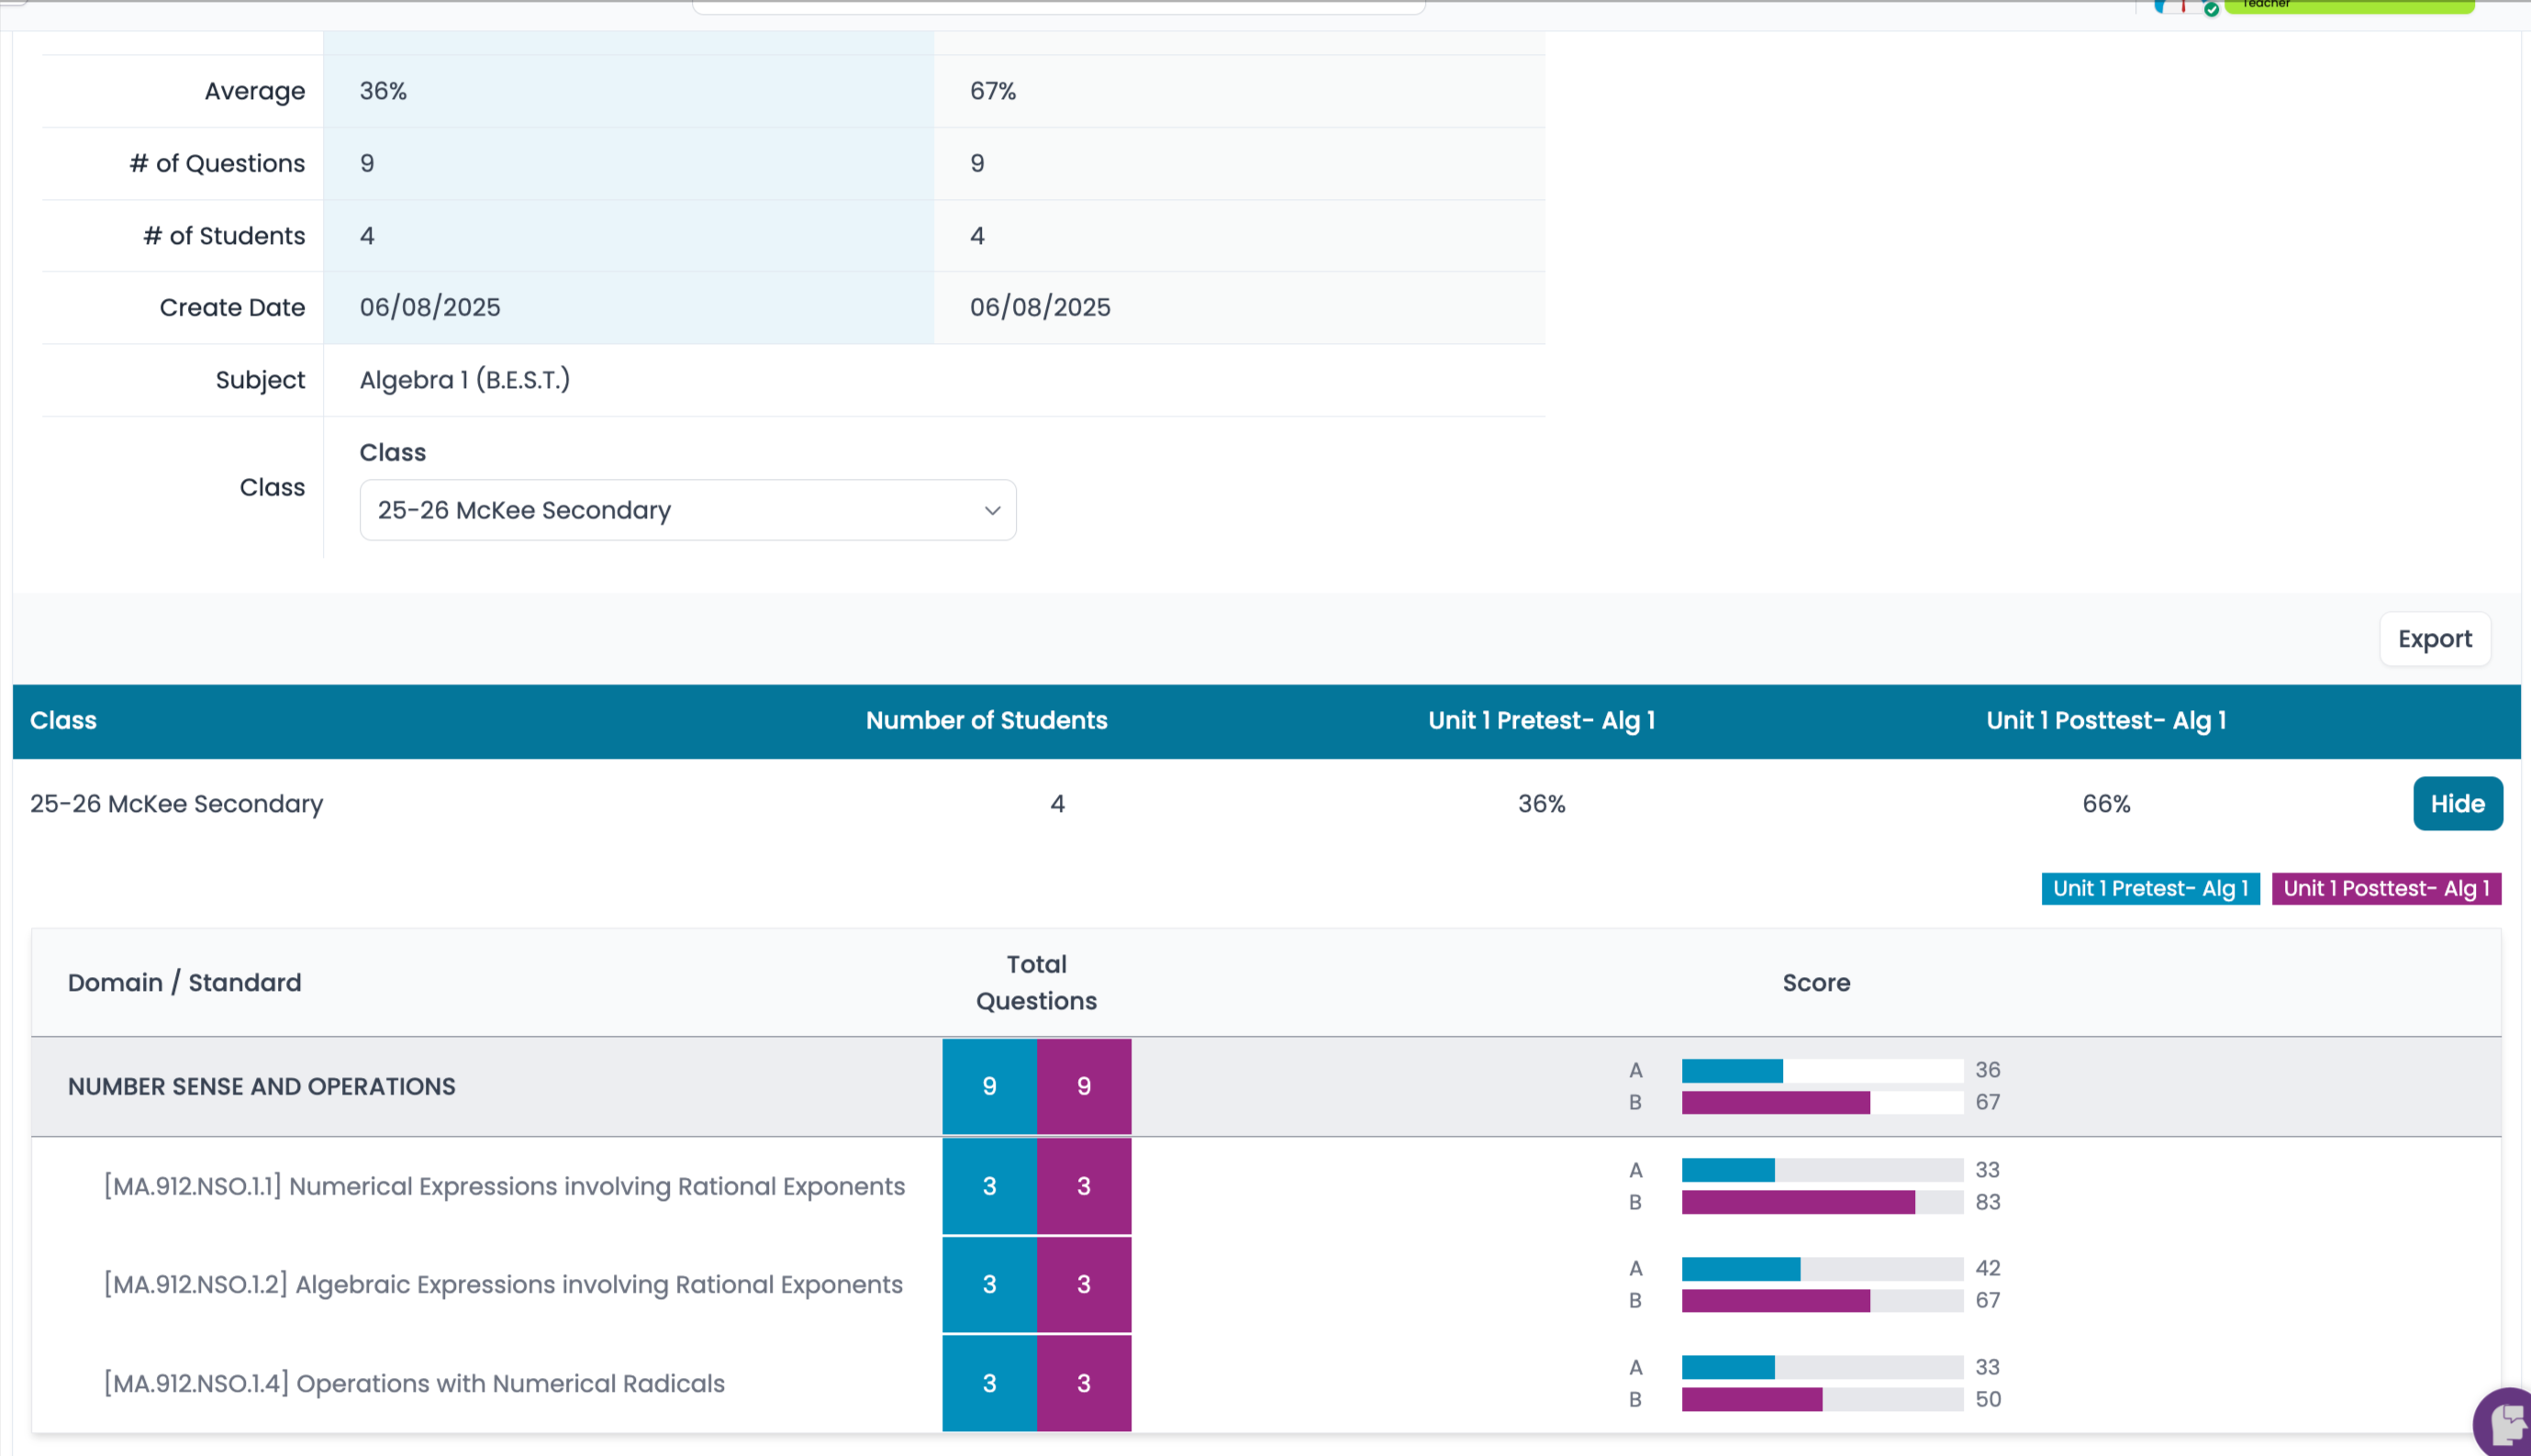
Assessment Comparison Report
- Where to find it?
- Reports menu (click on Reports from the side menu bar and select the Assessment Comparison Report).
- What data is displayed? The assessment results of both assessments will be shown side by side for each student. You can click on the "View" button next to any student and see a comparison report for a single student. The single-student view has an easy-to-read bar graph format that shows growth over time for each domain and standard.
- Exportable or Printable? Exportable
Student Diagnostic Strengths and Weaknesses (Texas teachers only)
- Where to find it?
- Reports menu (click on Reports from the side menu bar and select the Student Diagnostic Strengths and Weaknesses Report).
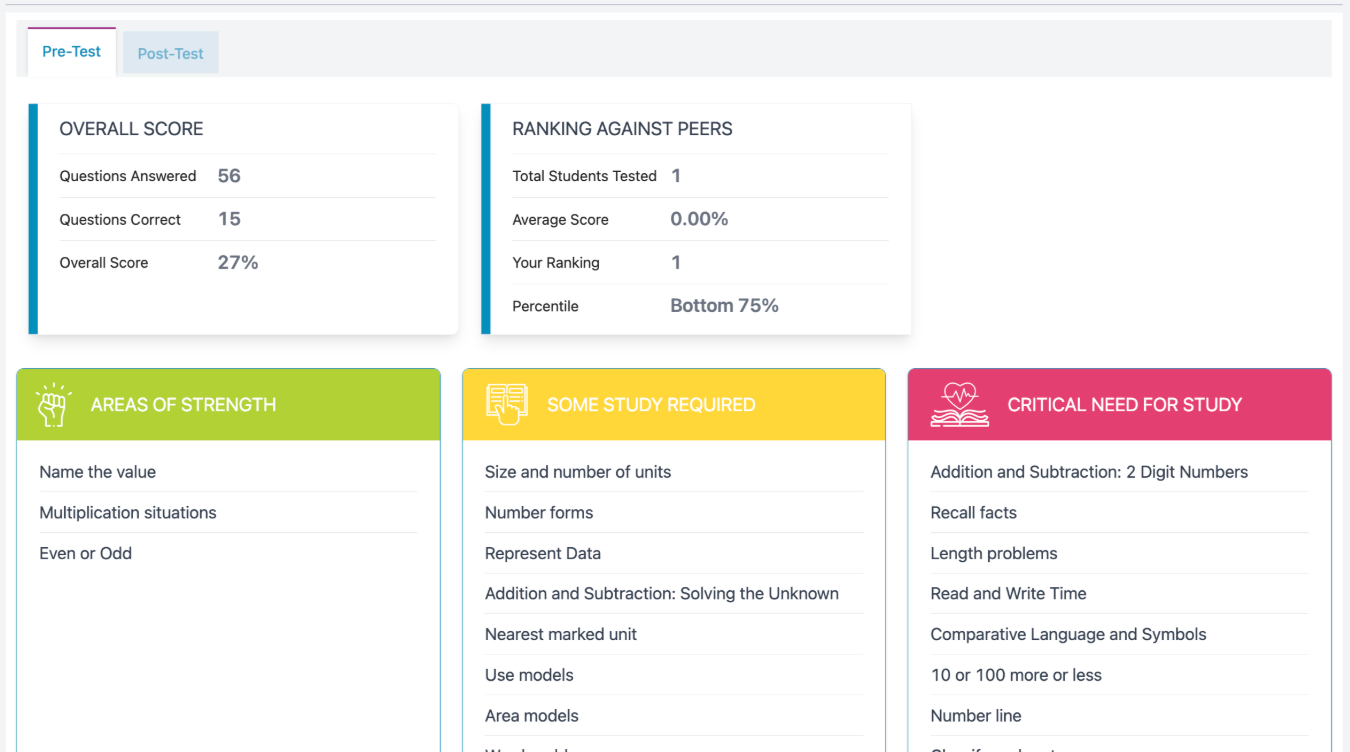
- What data is displayed? When students complete a Progress Learning diagnostic pre-test or post-test, teachers can see an individual student's overall score and a list of their demonstrated strengths and weaknesses. ** The Pre-made diagnostic pre and post tests are only available in Texas in certain subject areas and grade levels.
- Exportable or Printable? Exportable and Printable.
For more information about how to assign these diagnostic pre and post tests, click here.
Results Report(Assessment View)
- Where to find it?
- From the side menu, click on Assessments and navigate to the Assessment Bank
- Click on the hyperlink number in the Results column
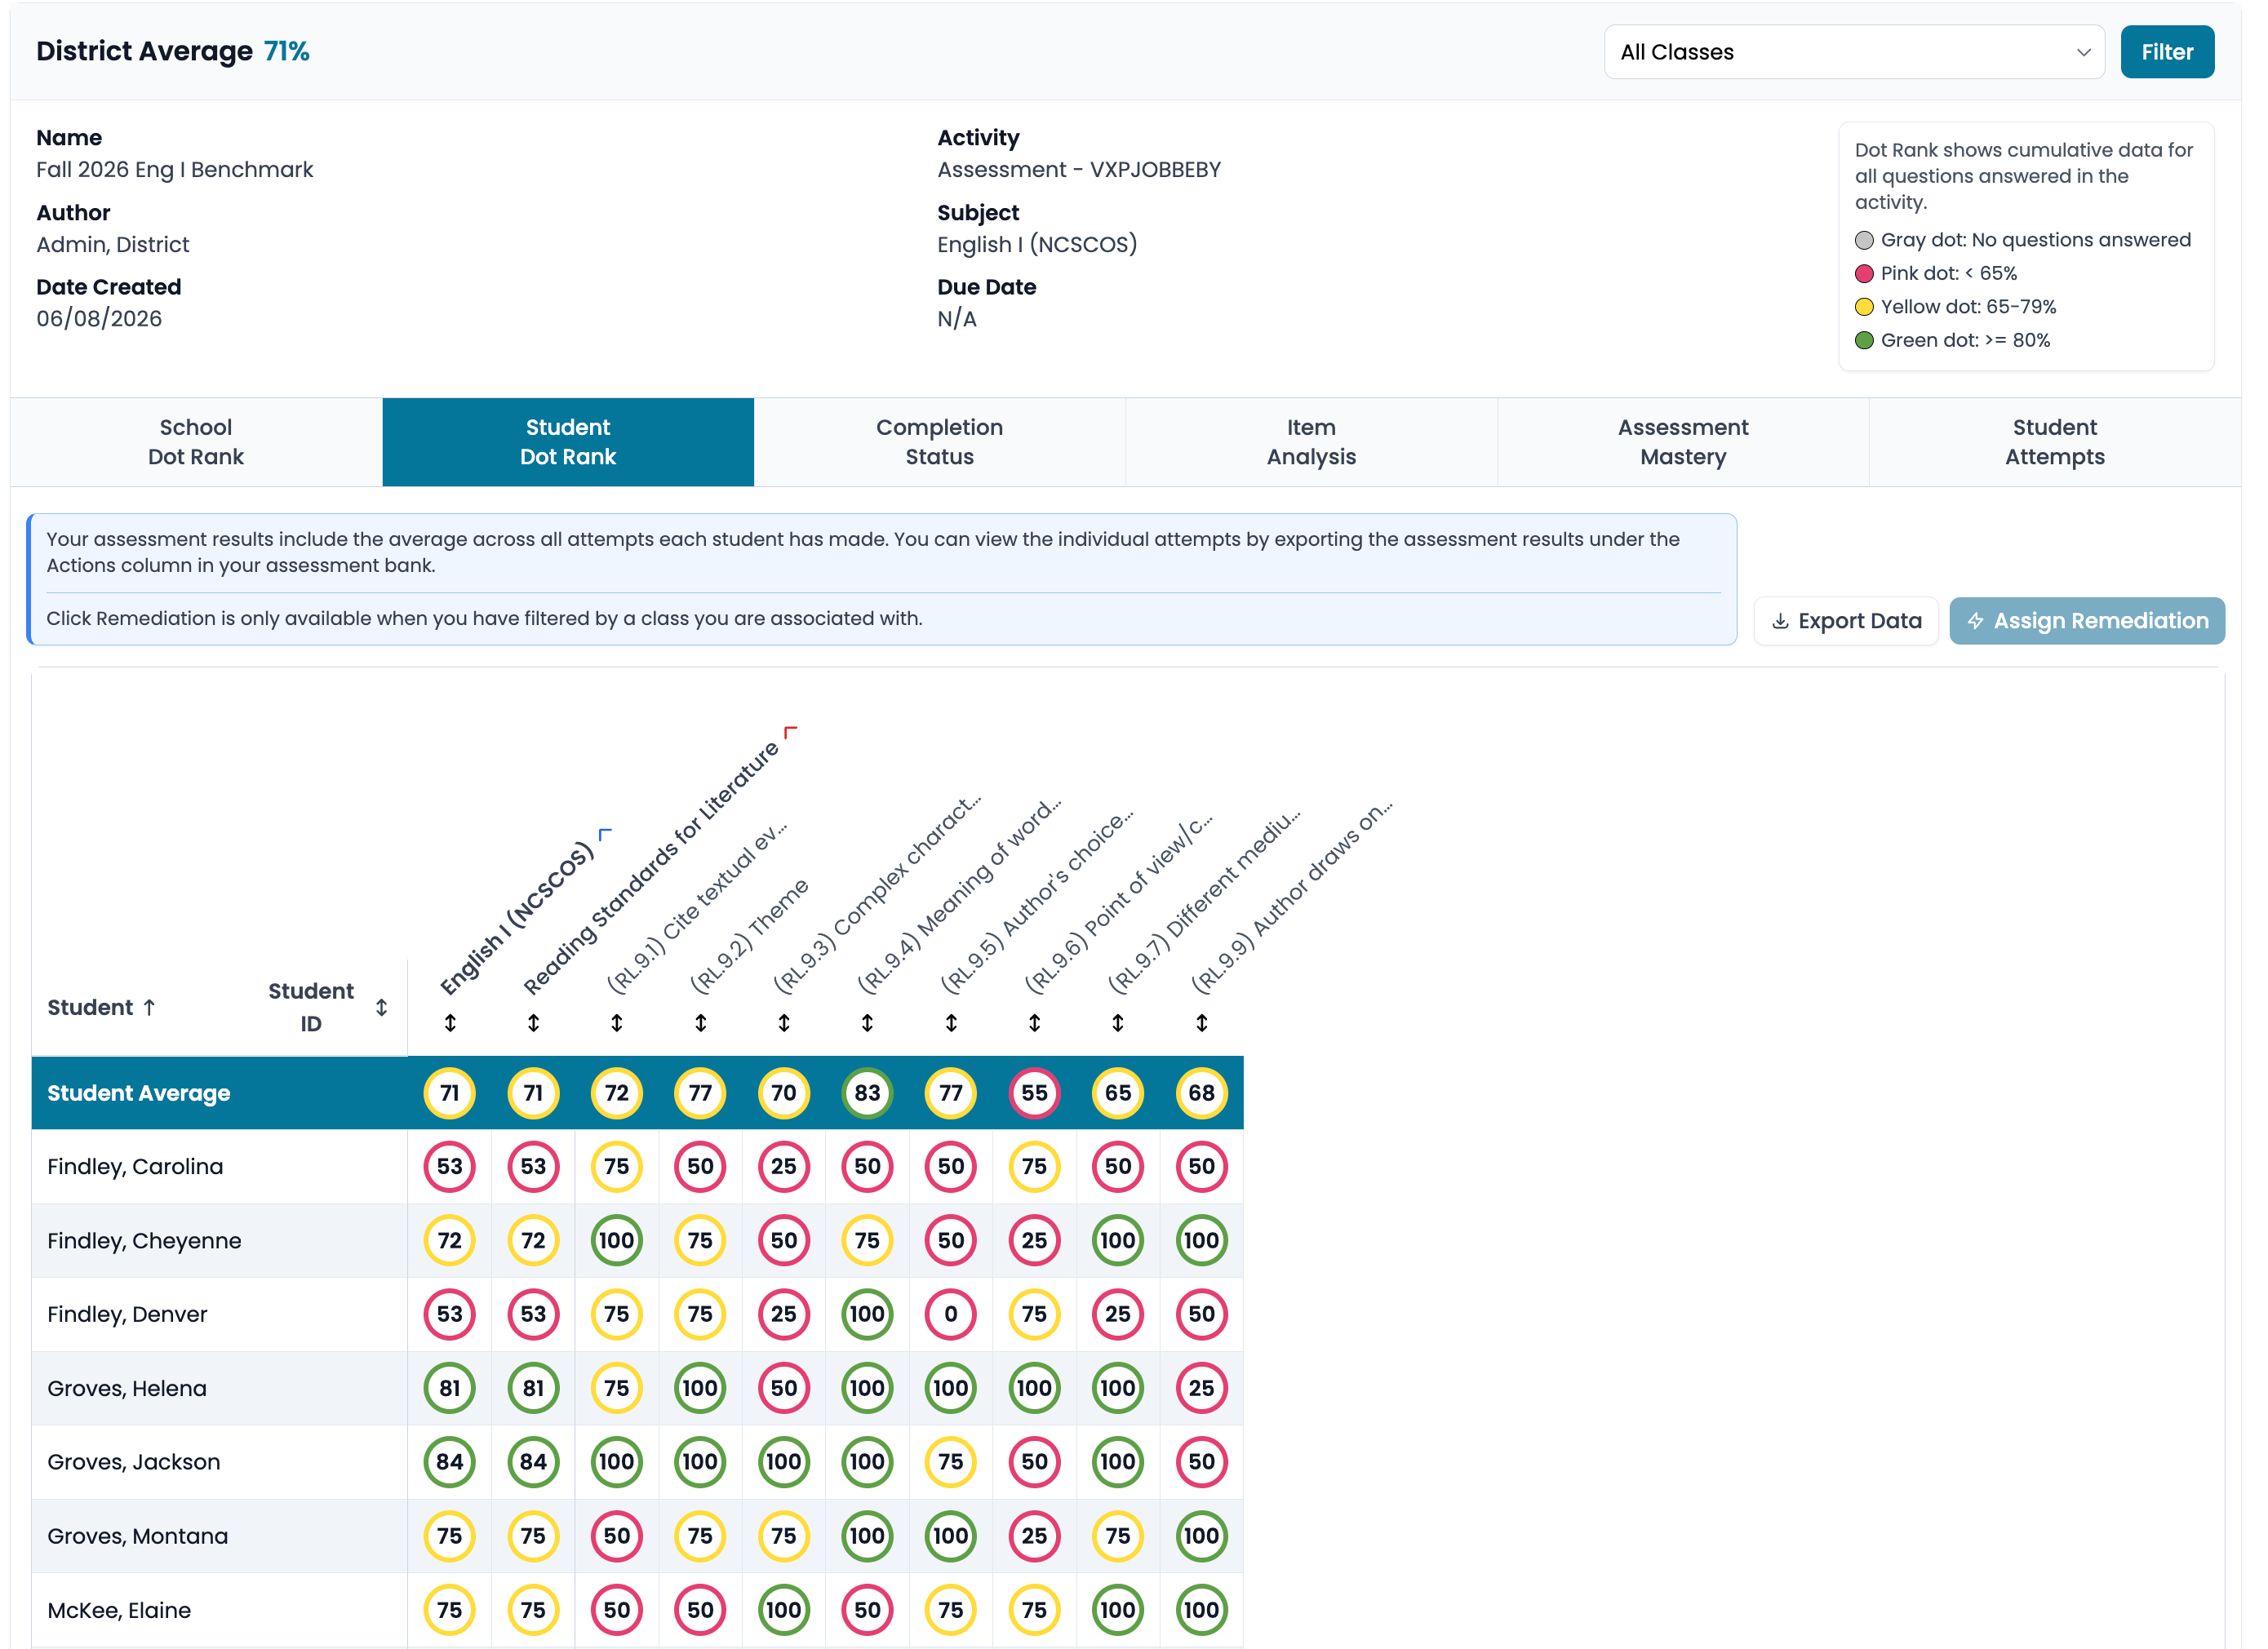
- What data is displayed? If there are multiple attempts, the "Student Dot Rank" tab will show the average score.
Results Report, when accessed via the assessment bank, displays the average score. Results Report, when accessed via the assignment bank, displays the highest score attempt.
- Exportable or Printable? The data on the Student Dot Rank and Student Details tabs are exportable. For Admins, the data on the School Dot Rank tab is also exportable.
Results Report(Assignment View)
- Where to find it?
- From the side menu, click on Assignments and navigate to the Assignment Bank
- Click on the hyperlink number in the Results column
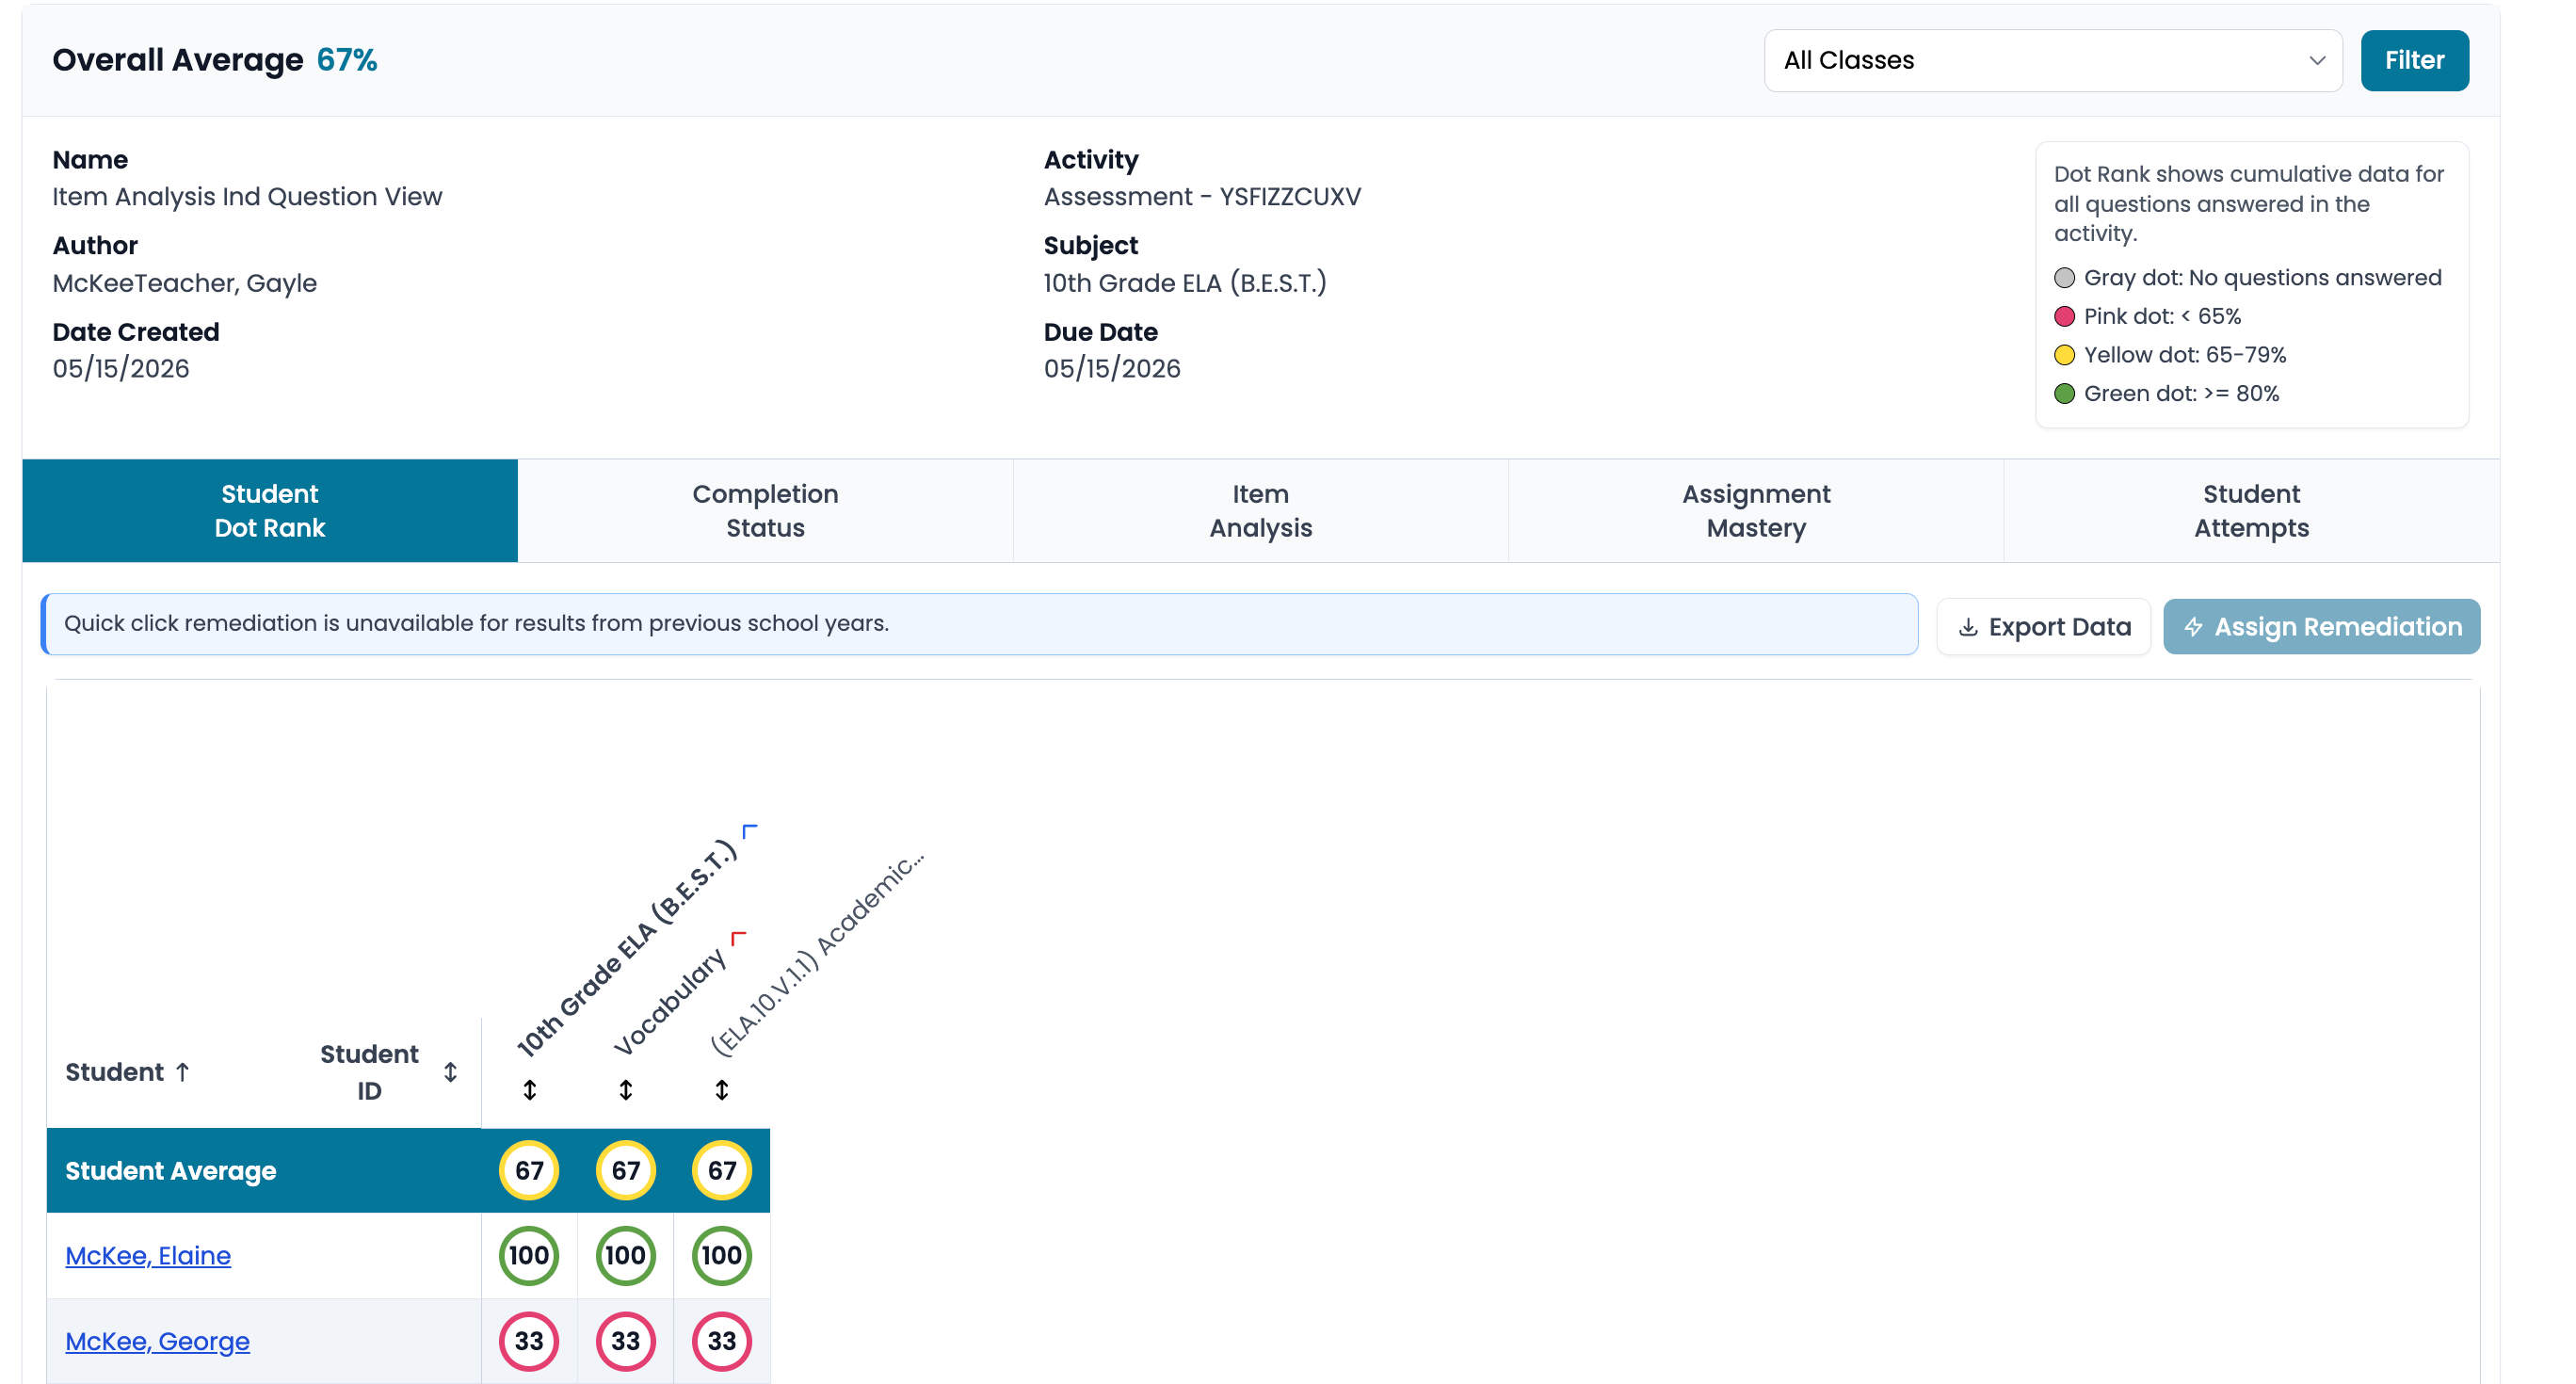
- What data is displayed? If there are multiple attempts, the Student Dot Rank tab will show the best attempt. This matches the data displayed in the grade book. Each student's name is hyperlinked to view more detail on their best attempt.
- Exportable or Printable? The Student Dot Rank tab and the Student Details tab are exportable. The Assignment Mastery tab is printable
Export Assessment Results Report
- Where to find it?
- From the side menu, click on Assessments and navigate to the Assessment Bank
- Click on the hamburger menu in the Action column.
- Select Export Results.
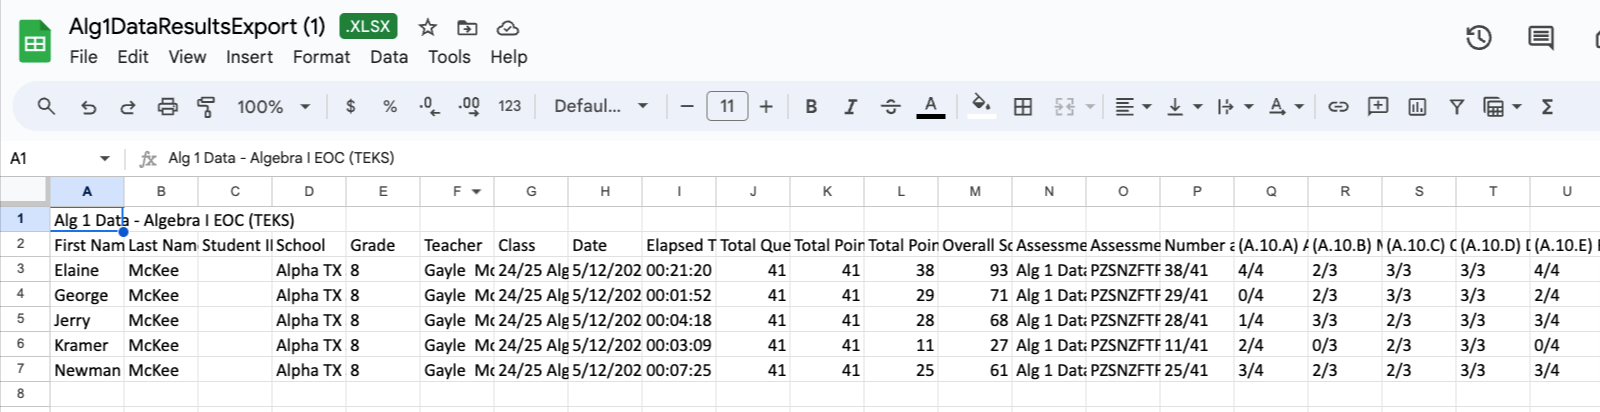
- What data is displayed? This will show all attempts by students on the assessment with a breakdown by overall score, domain, and standard. If there are multiple attempts for a single student, you can view each individual attempt.
- Exportable or Printable? Exportable
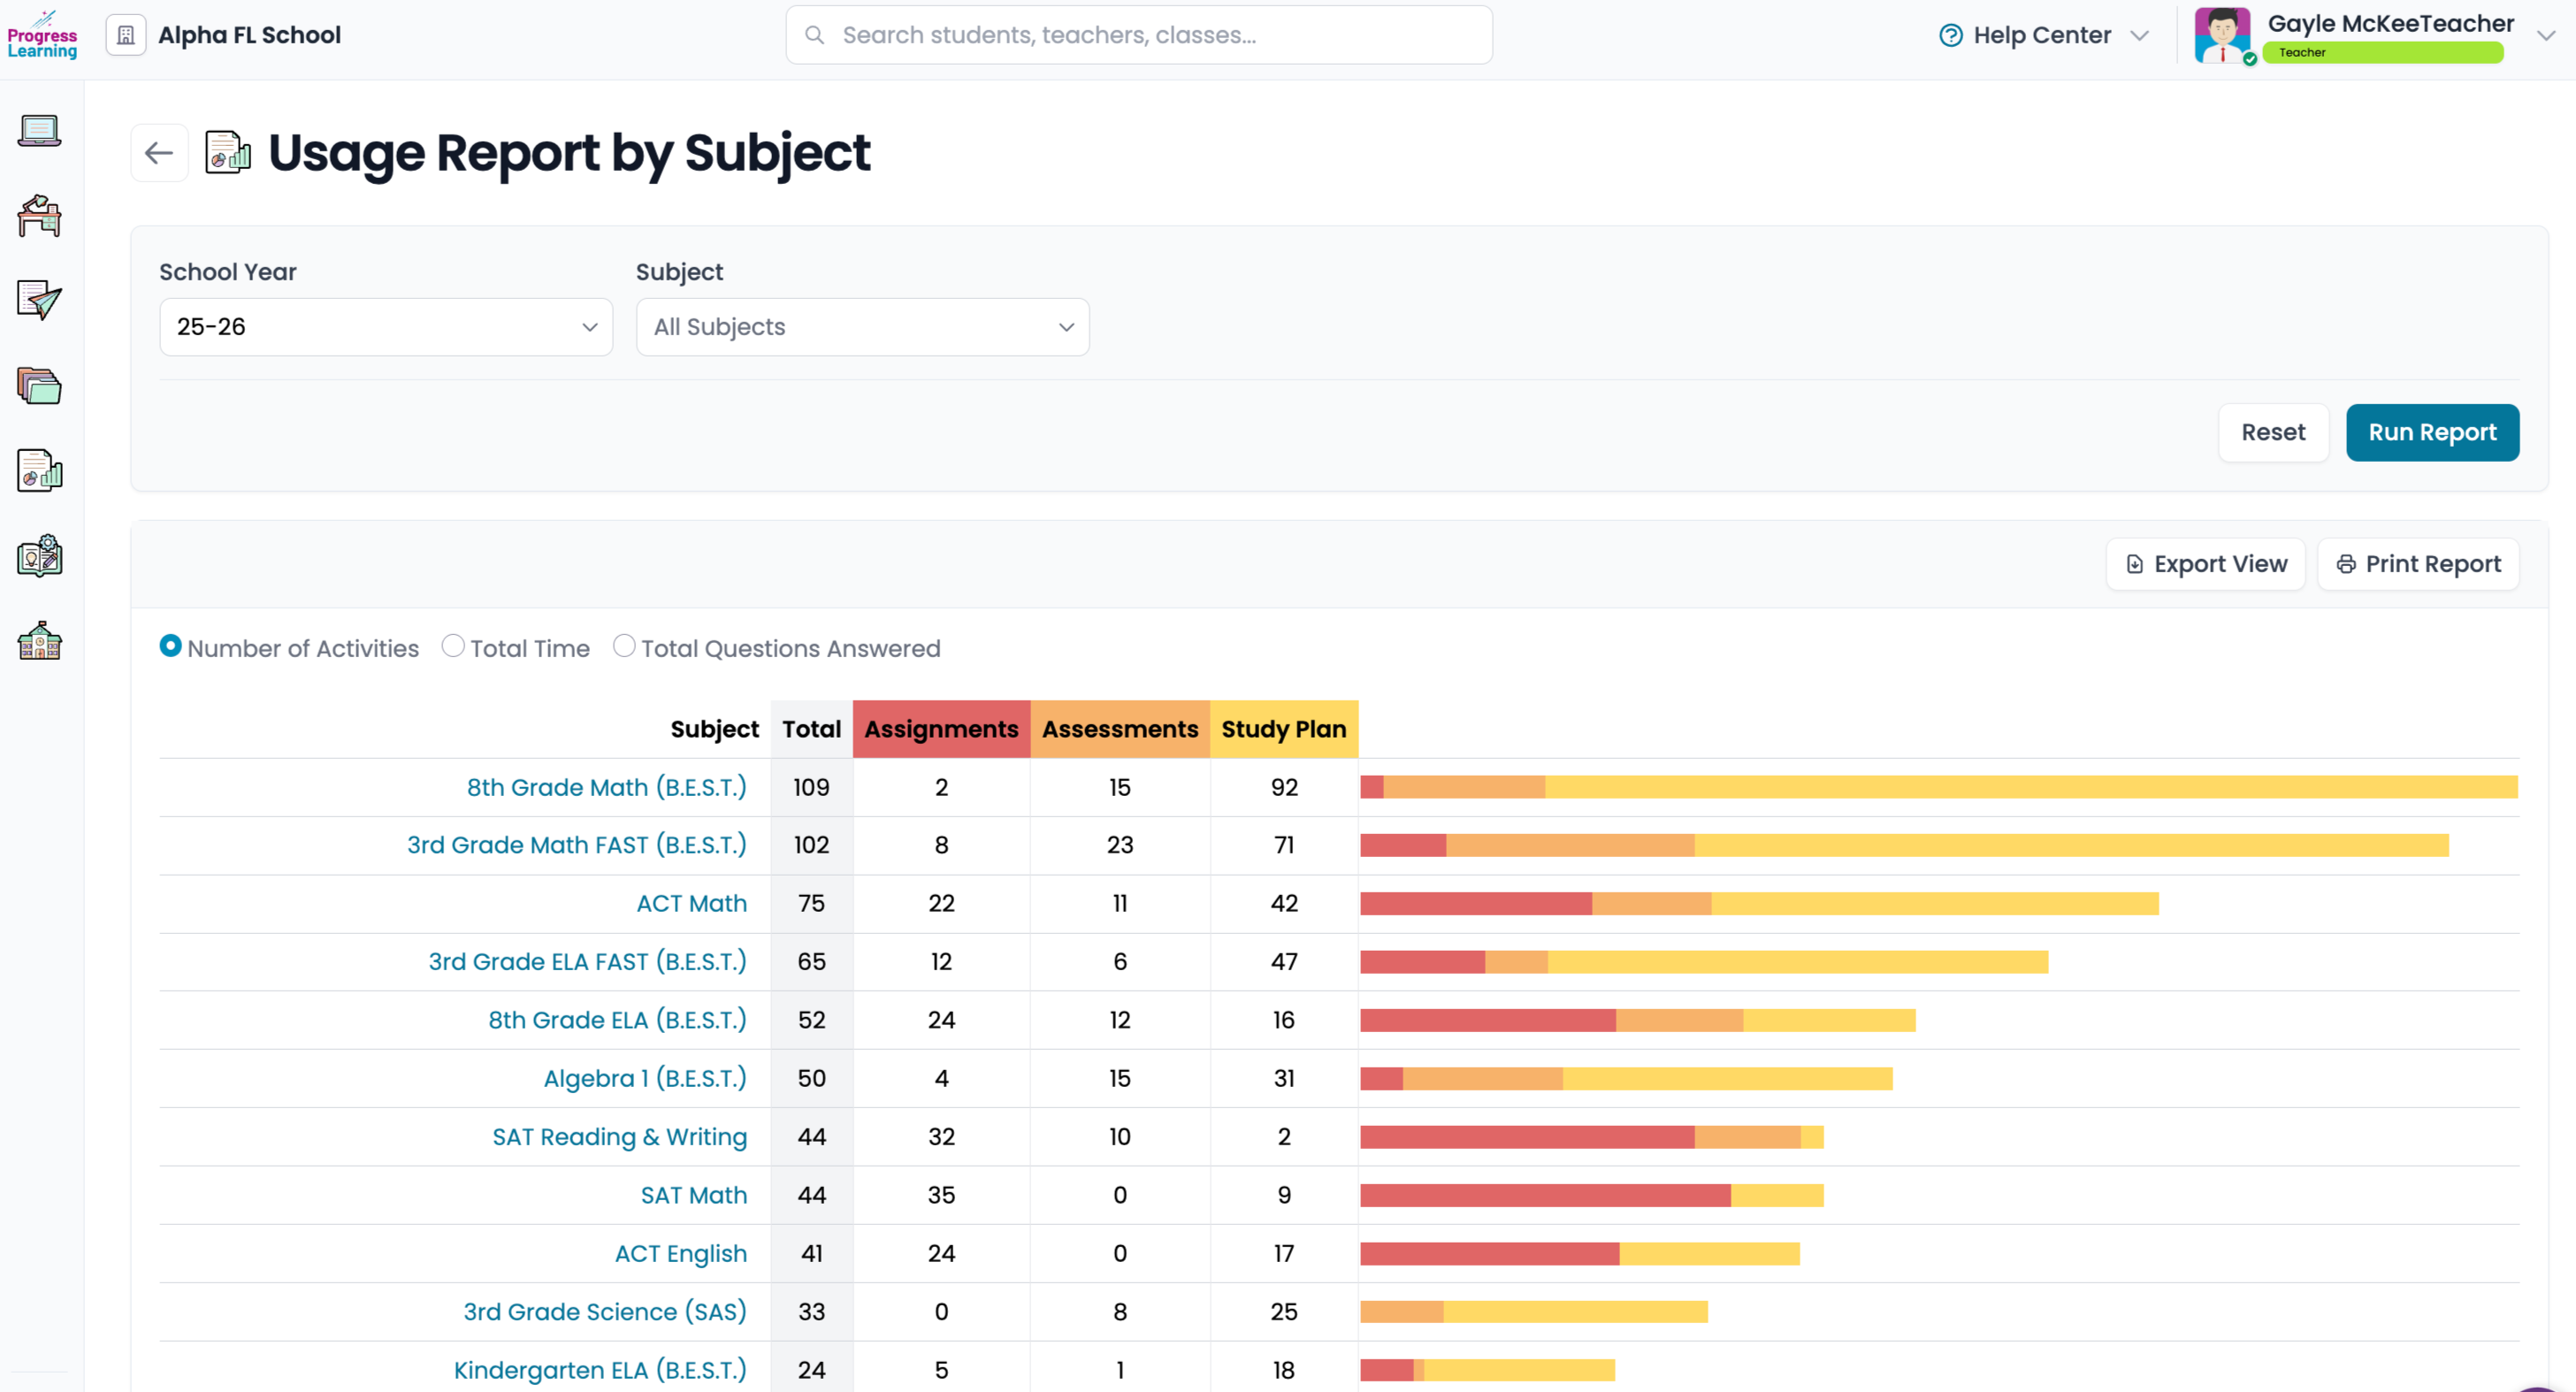
Usage Report by Subject
- Where to find it?
- Reports menu (click on Reports from the side menu bar and select the Usage Report by Subject).
- What data is displayed?
See which subjects are being used the most down to the least in your school.
Use the radio buttons to switch between the different types of data. You can choose to view the number of activities, total time, or total number of questions answered on assignments, assessments, and in the student plan.
- Exportable or Printable? Exportable and Printable.