How Do I Access and Use ACT/SAT Results Reports?
 Updated
by
Luli Vazquez
Updated
by
Luli Vazquez
The ACT®/SAT® Results Report can be accessed by both School Administrators and Teachers regardless of who assigned it.
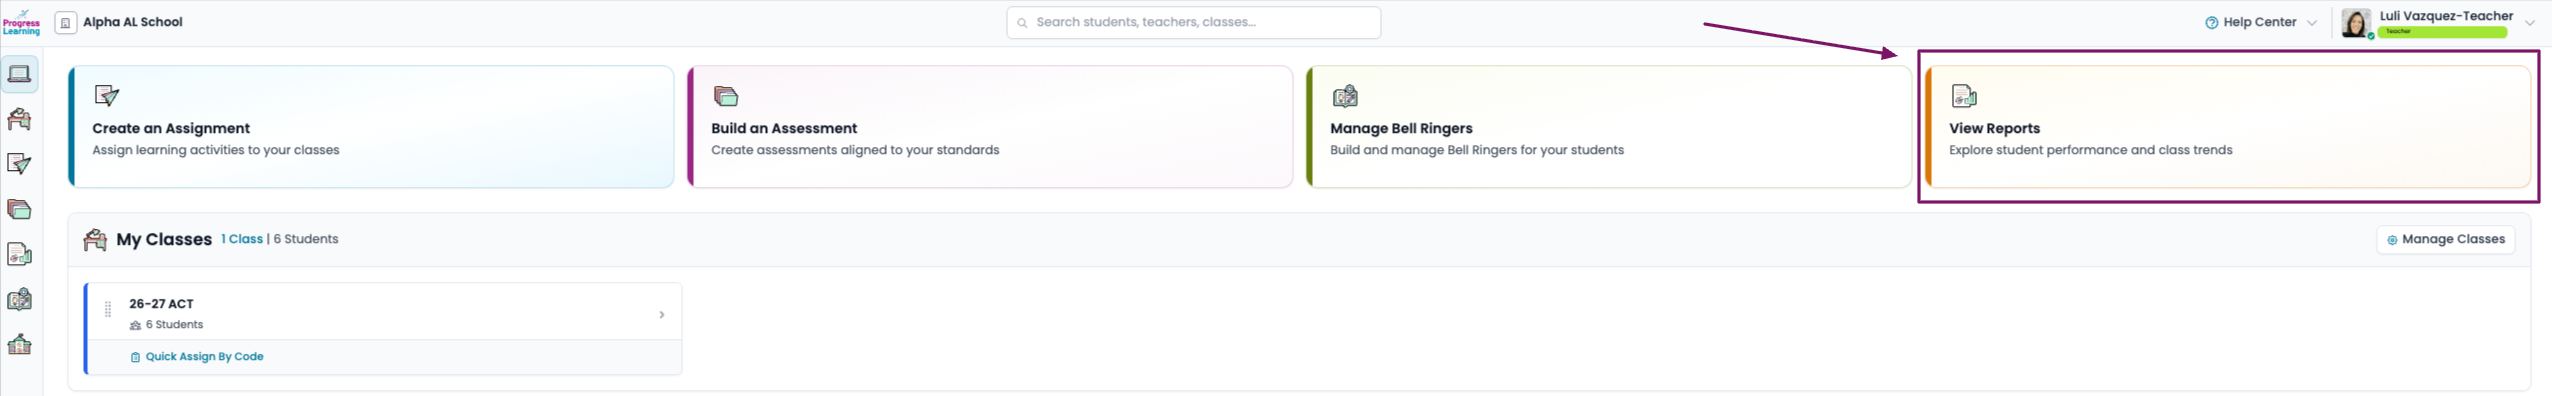
- From your dashboard, click View Reports.
- Scroll or navigate to College & Career Readiness Reports.
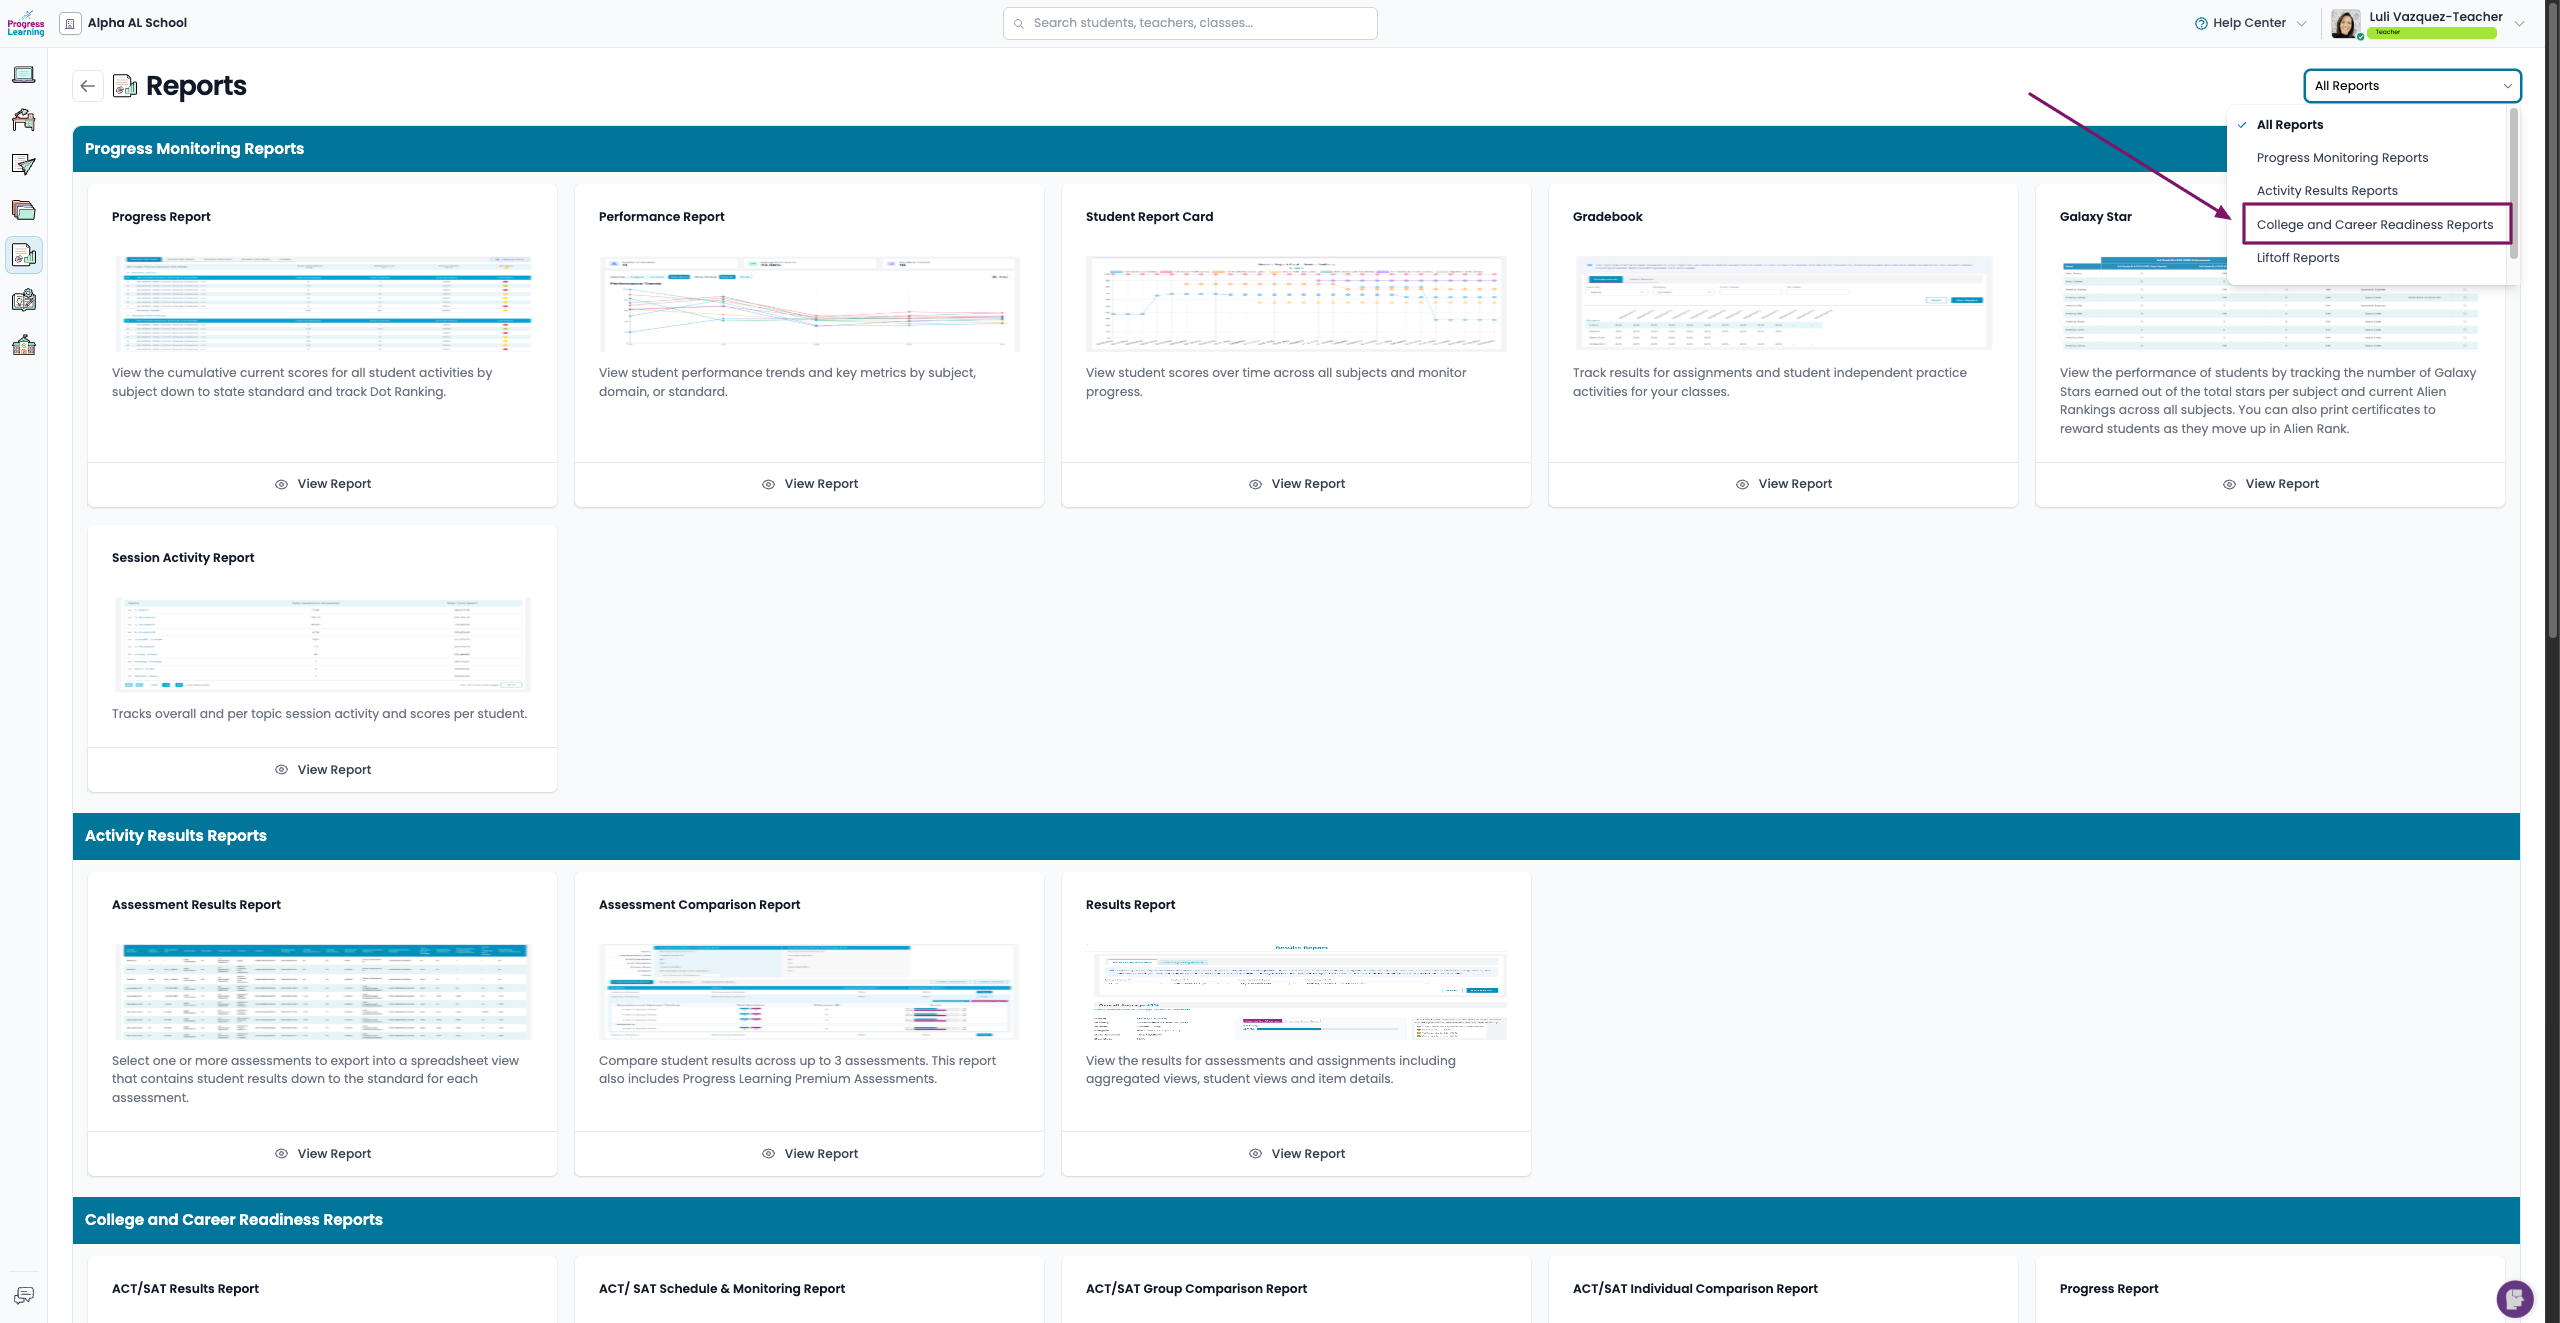
- Select the report type you want to view:
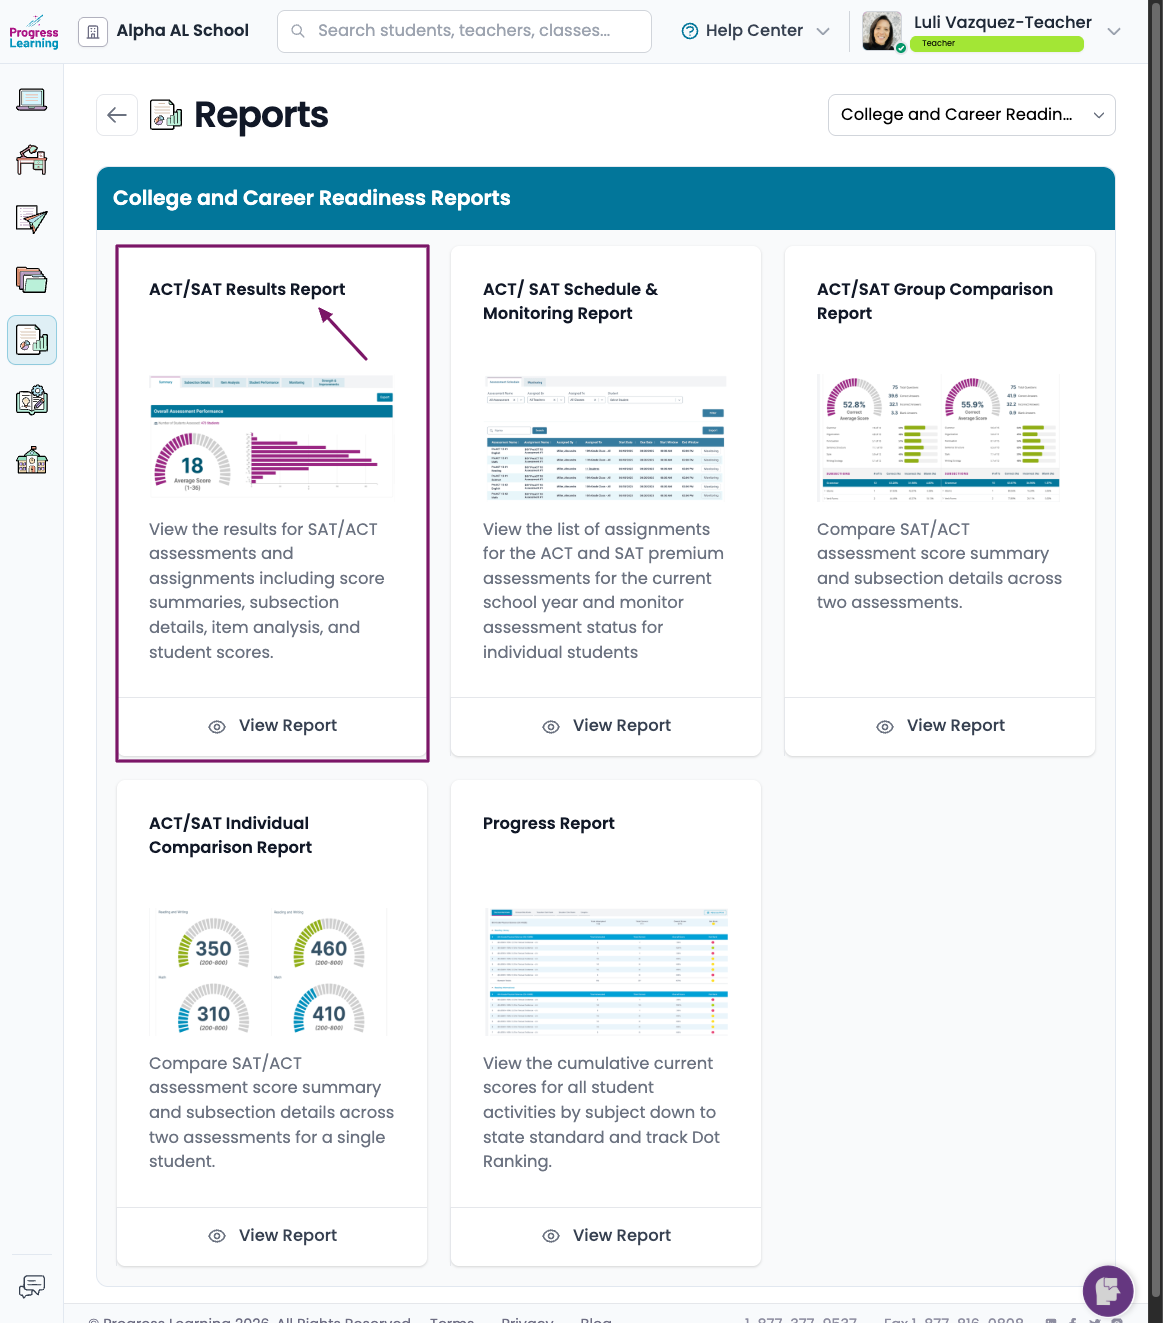
- ACT/SAT Results Report – Displays performance data for full classes or grade levels to help track group-level progress and readiness.
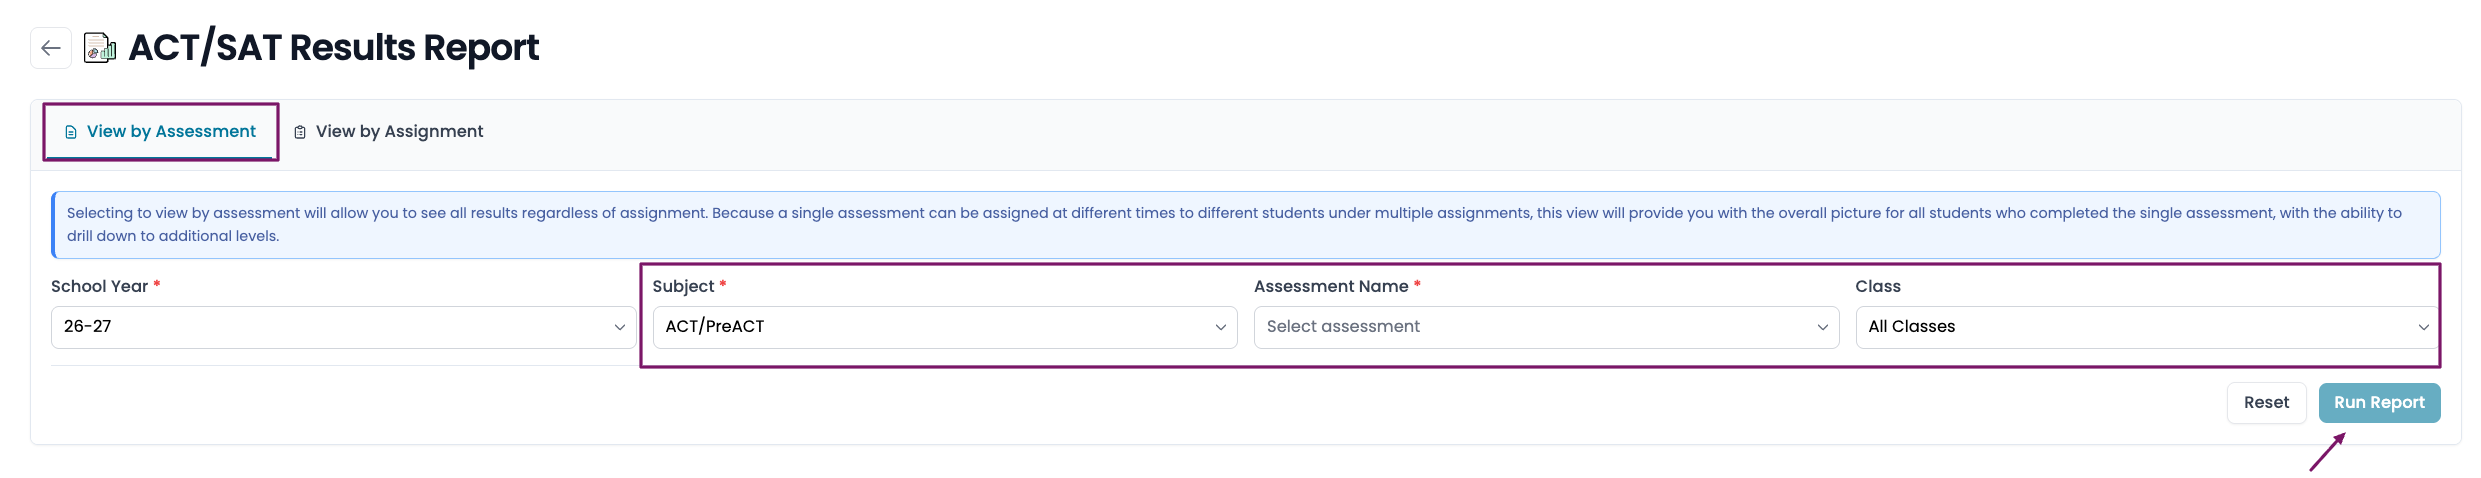
- Use the filters to refine your report:
- Select the school year, subject, assessment name, class, any assessment tags, any start date, and end date.
- Choose how you’d like to view your data:
- View by Assessment or View by Assignment. Select Run Report to generate your results.
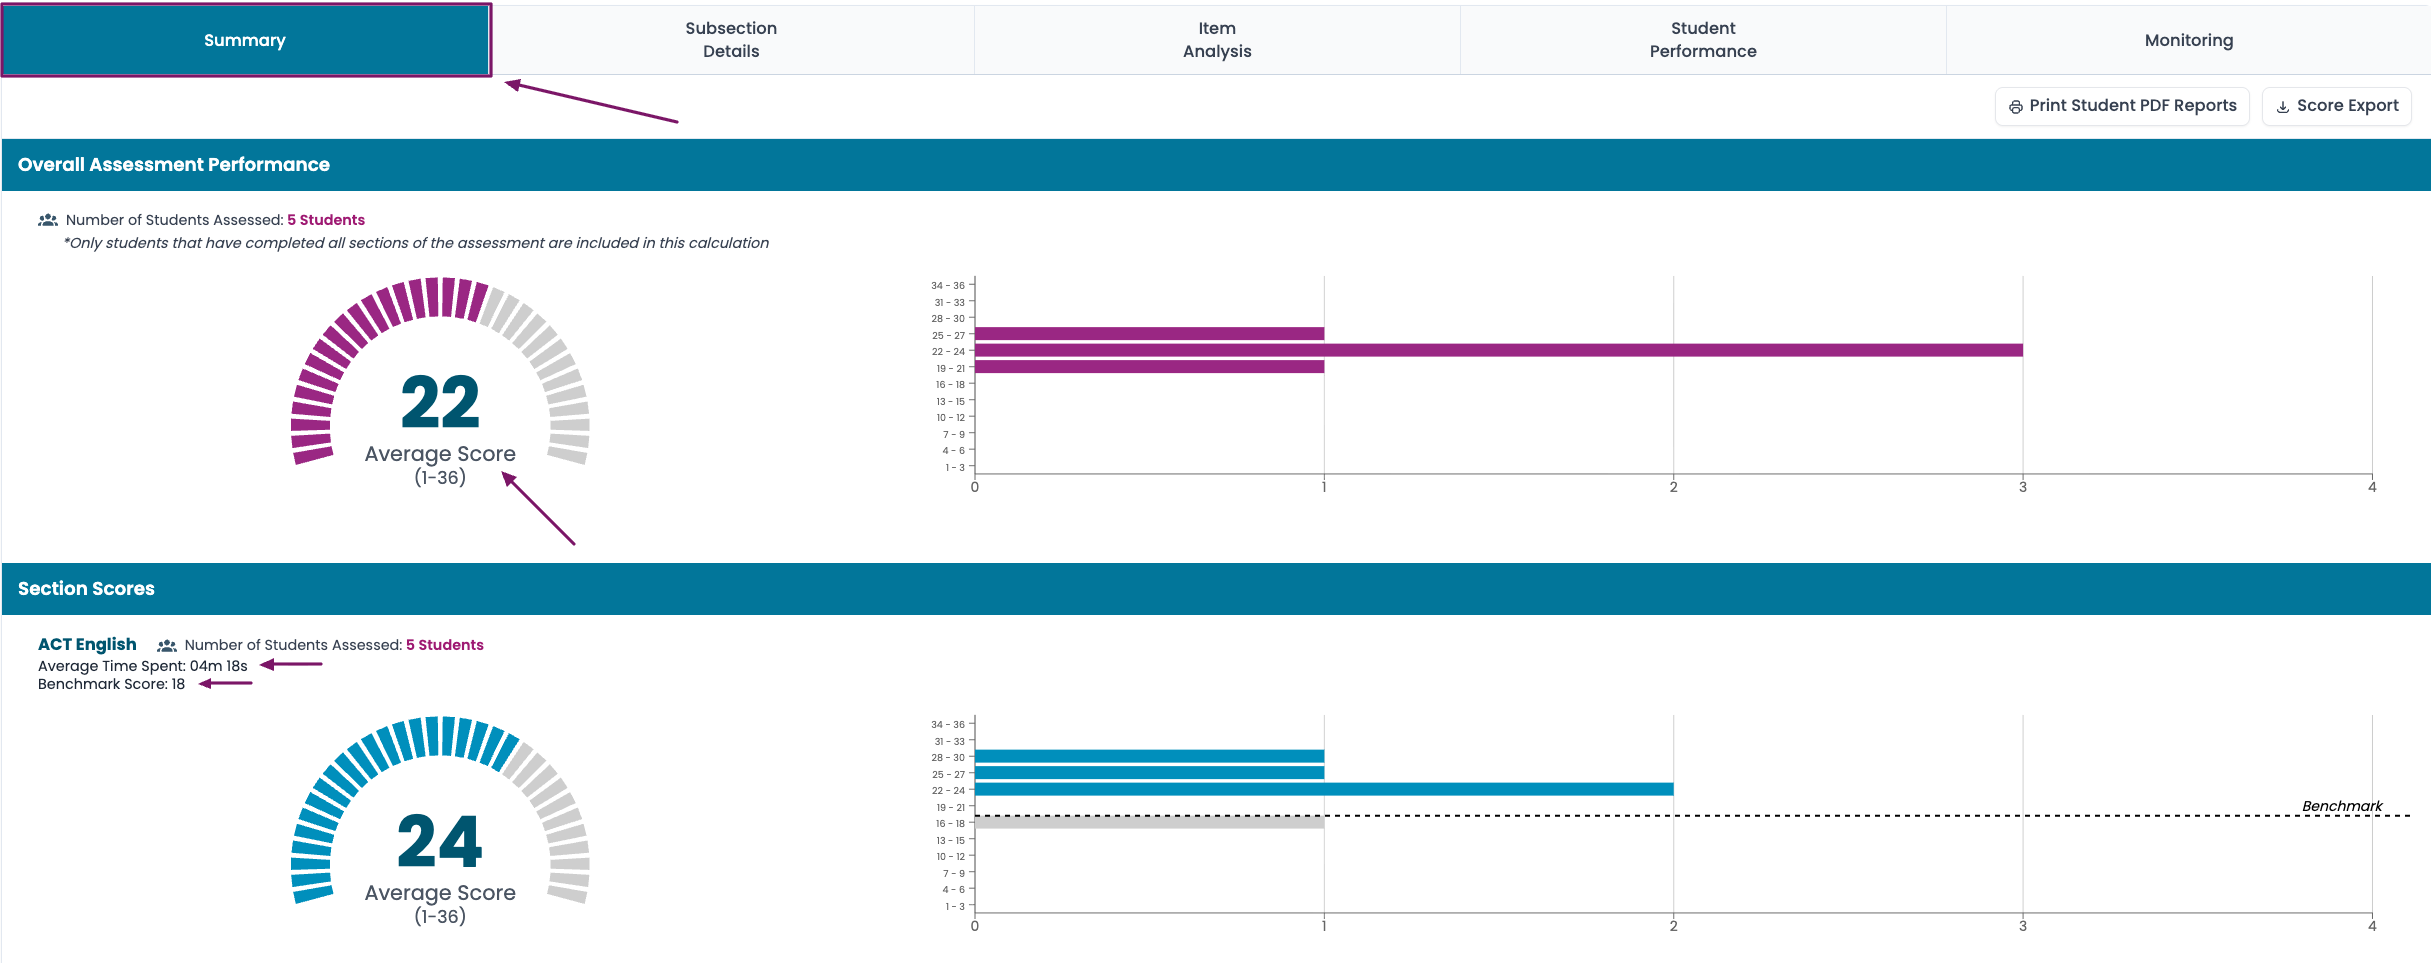
- Summary Tab - Provides an overview of student performance in Scaled Score language. This tab includes the following data:
- Average composite score
- Average score by section
- Average time spent by section
- Benchmark score by section (The benchmark listed here is the published benchmark, as set by ACT© Inc. or the College Board©. Target benchmarks may be different in your state.)
- Histogram (distribution of scores) by section
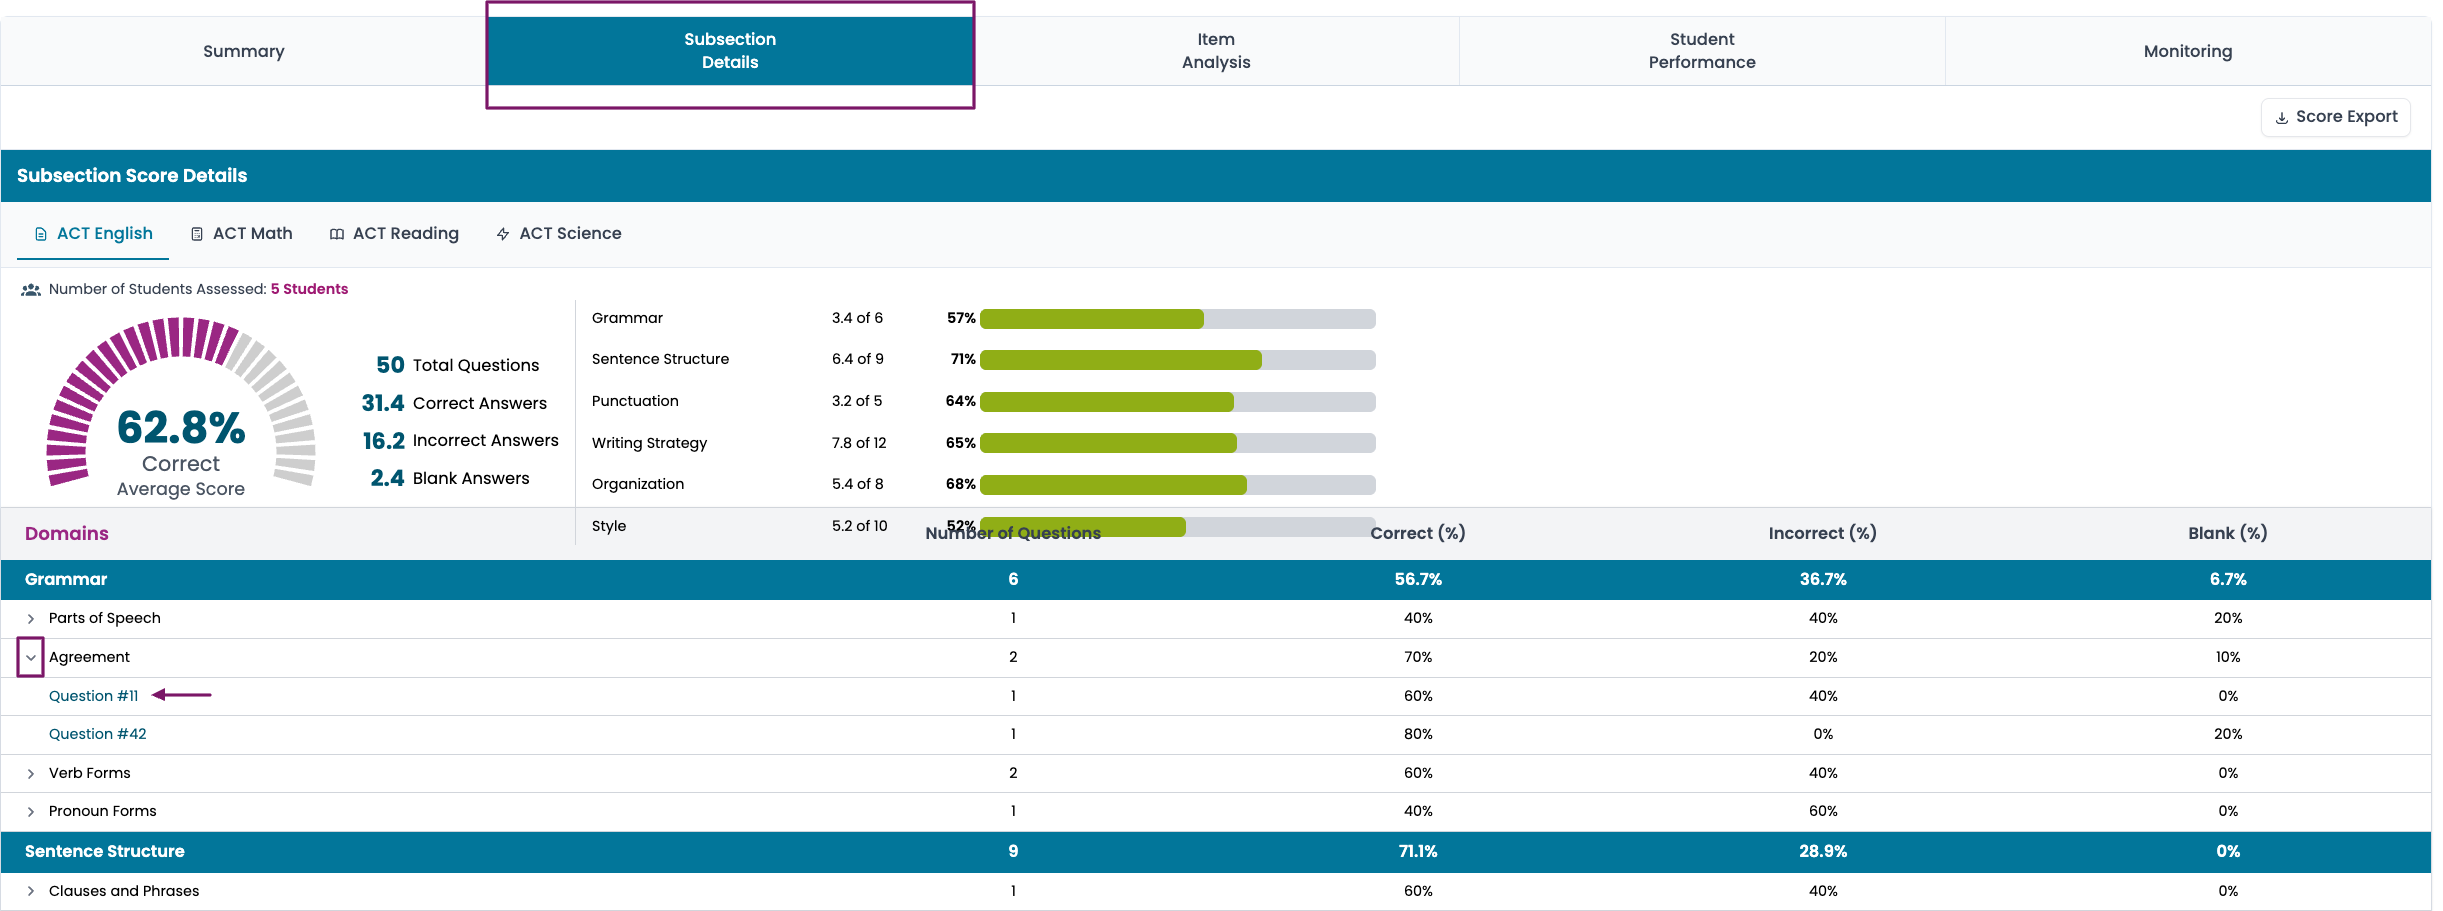
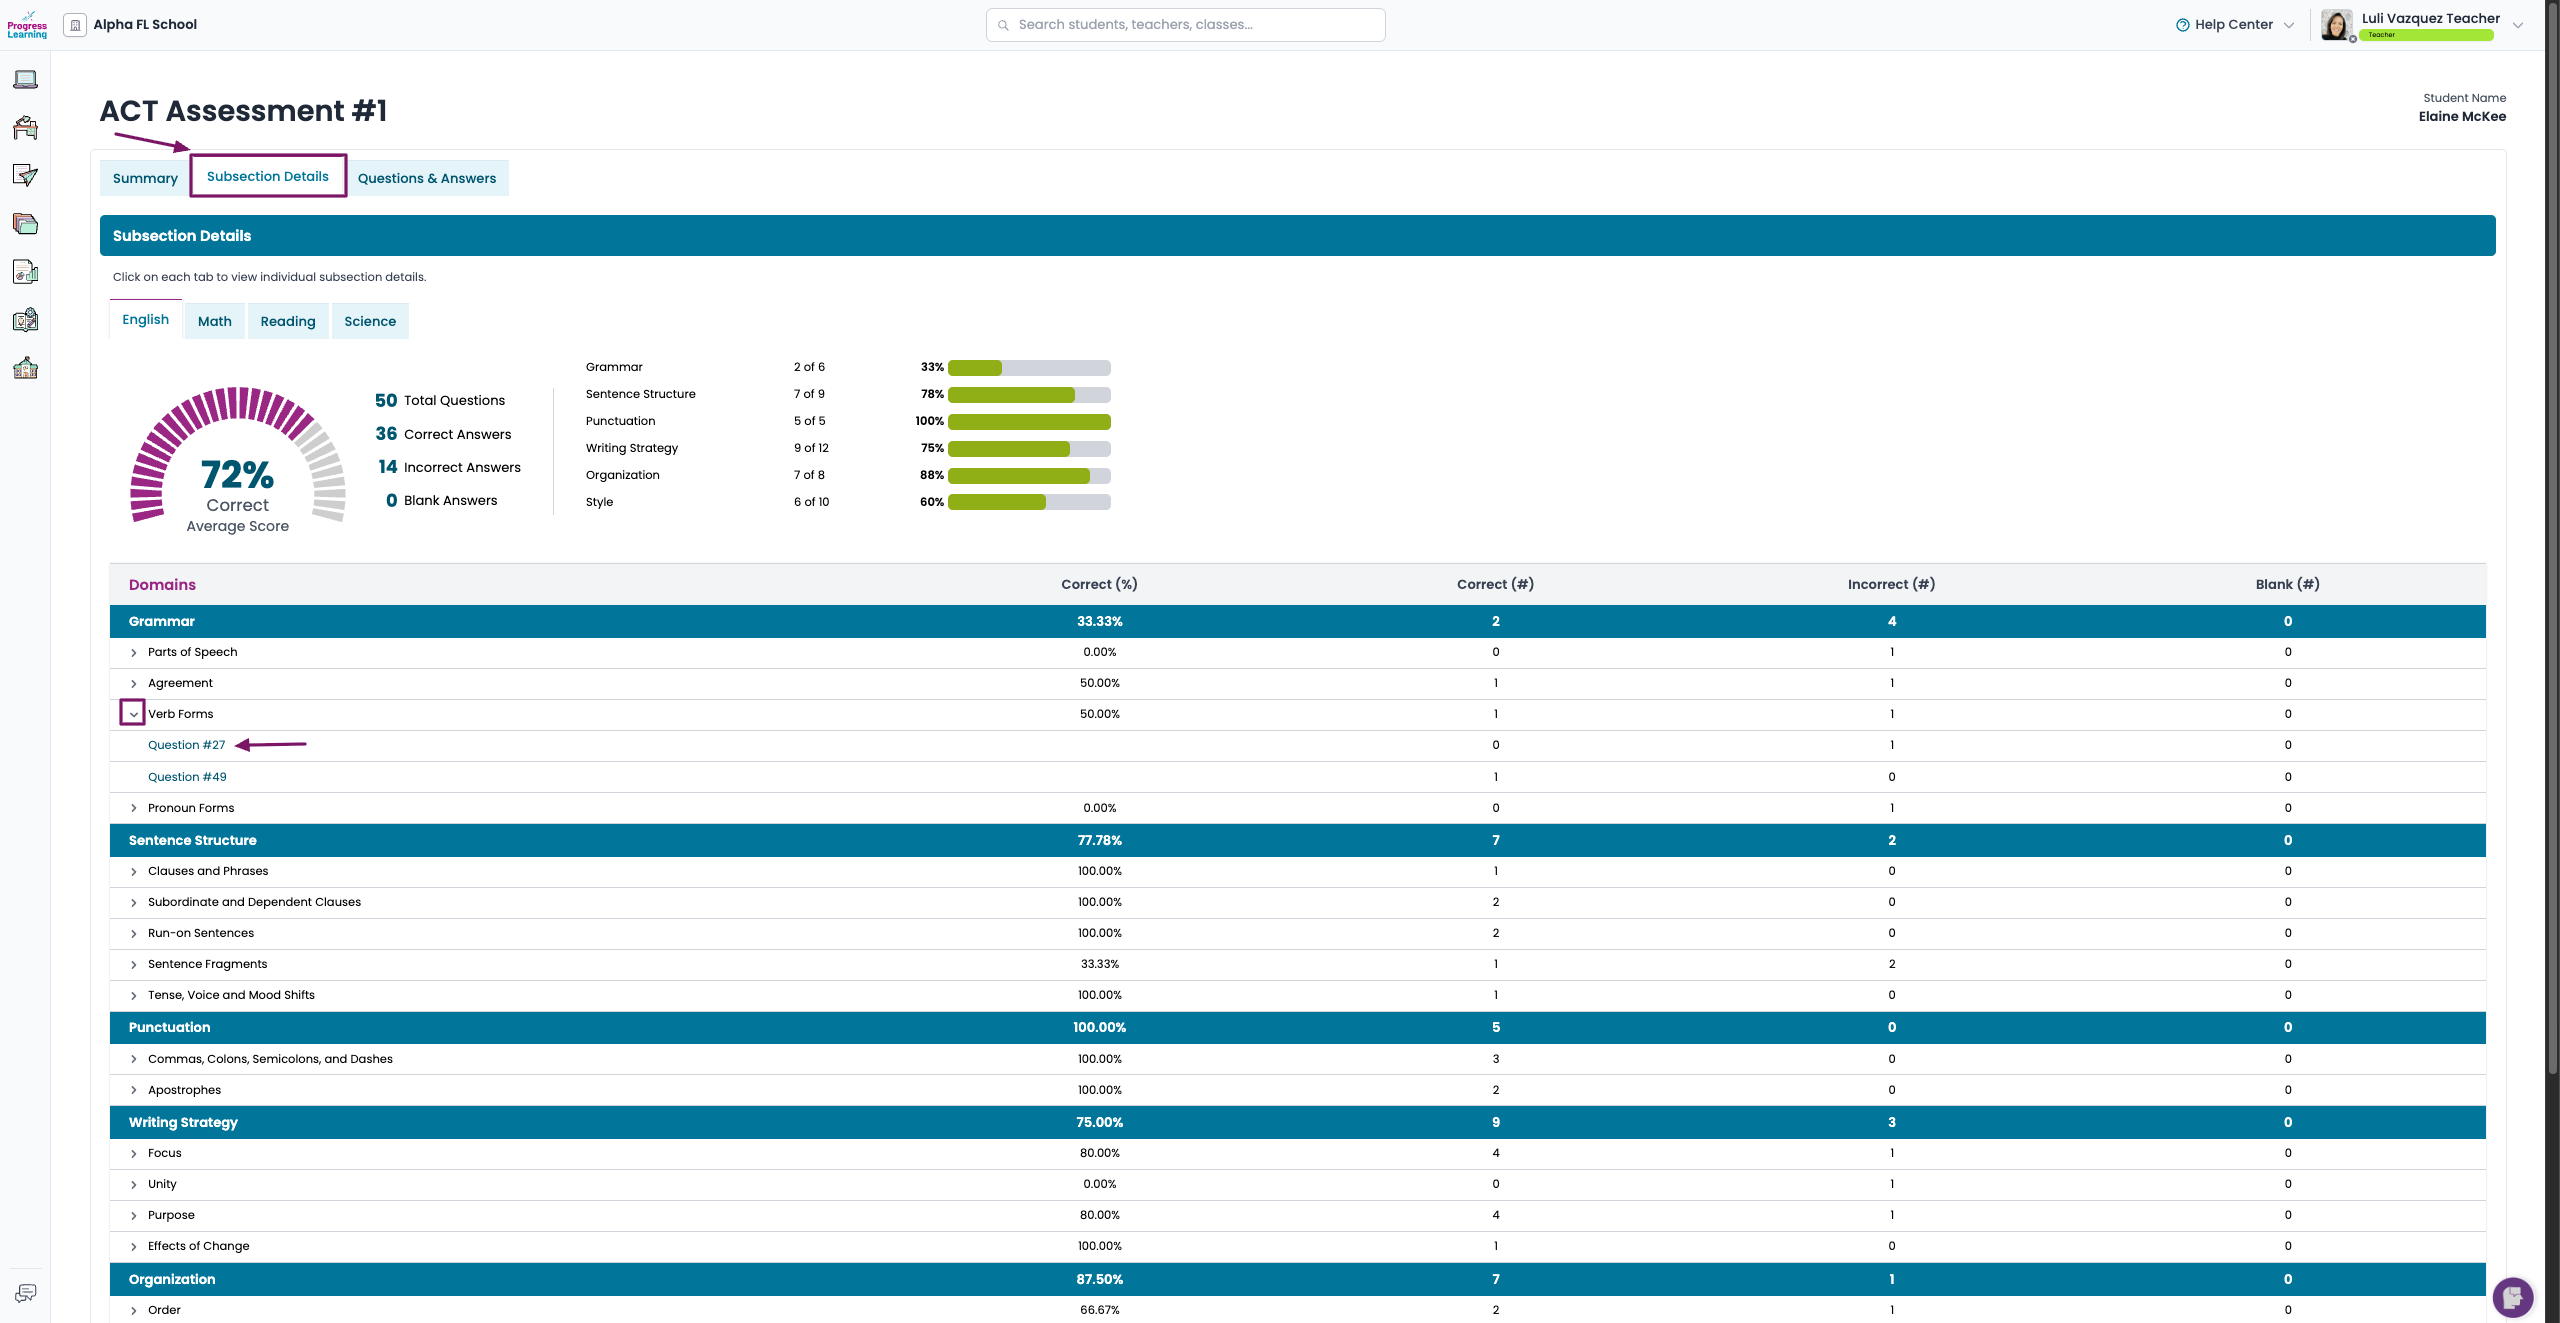
- Subsection Details - Provides an in-depth analysis of group performance on one section of the assessment. This tab is focuses on domain and topic performance. This tab is useful for analysis of student performance data to inform instruction and intervention topics, similar to the conversations that may occur in PLCs.
- Expand each topic using the carat on the left side to view the performance on individual items.
- Click the Question # to view a preview of the question with the correct answer marked.
Note that student names do not appear on this tab, therefore it can be used during review of the exam with students.
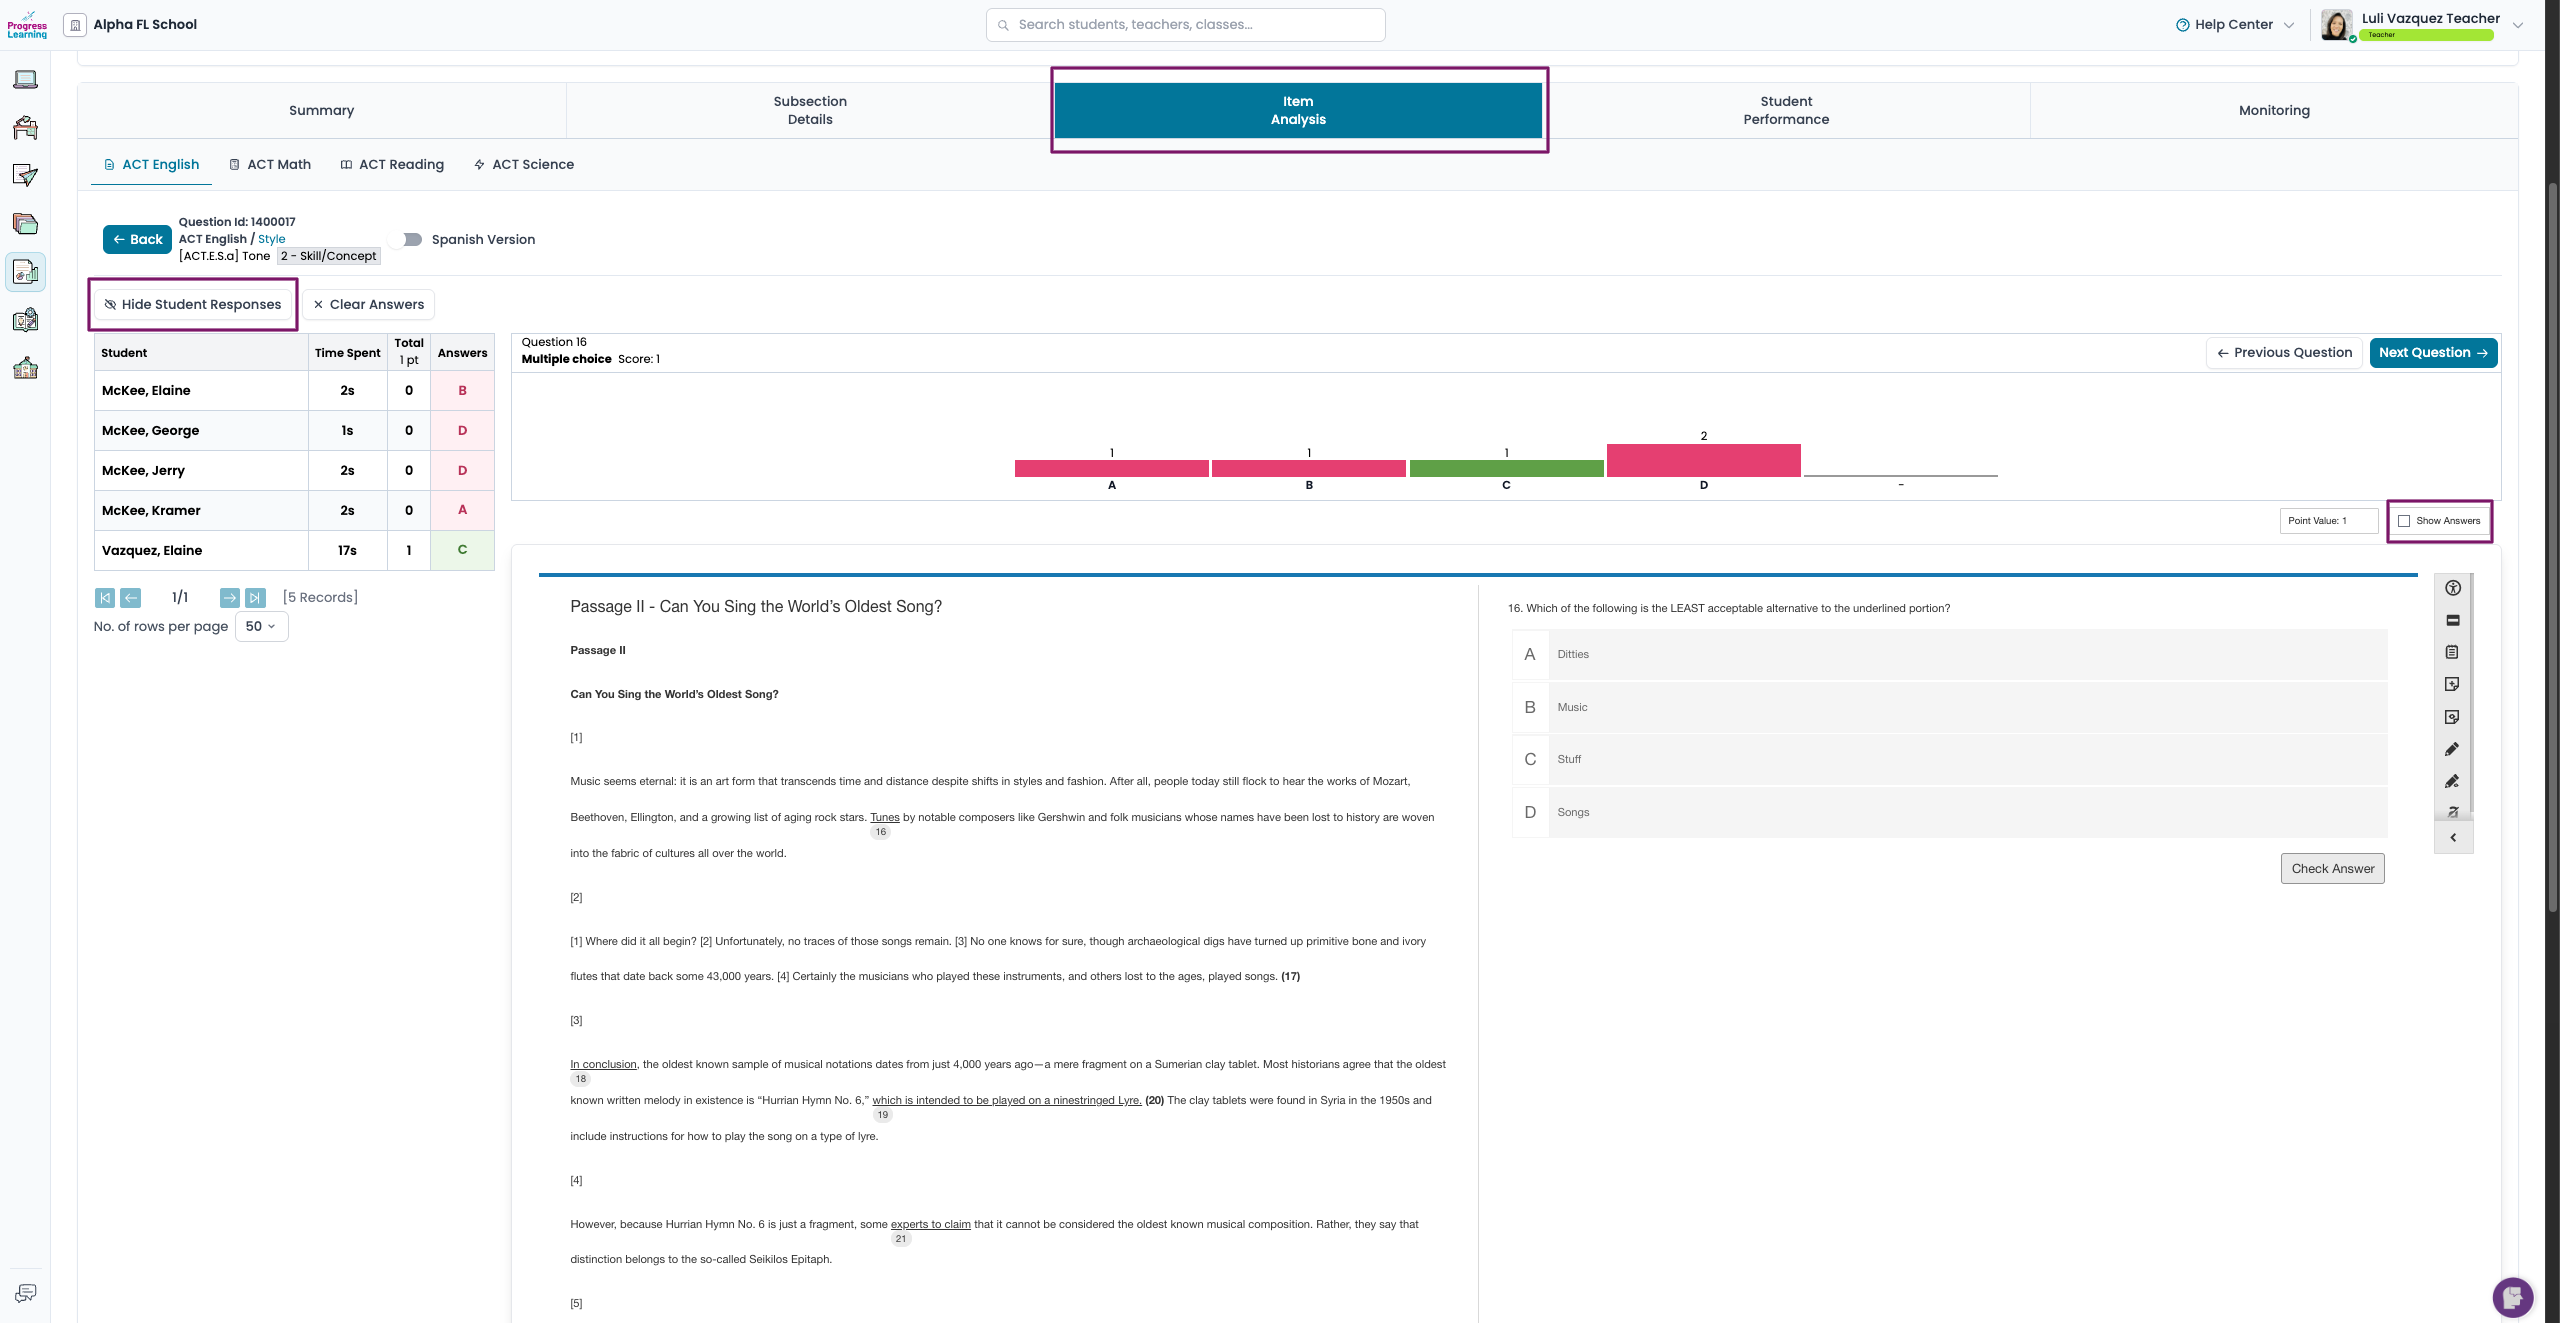
- Item Analysis - Provides an item-by-item and student-by-student view of the assessment. This report is most useful for item-level analysis of student performance. Use the Hide Student Responses button to mask student names when reviewing data in a group setting.
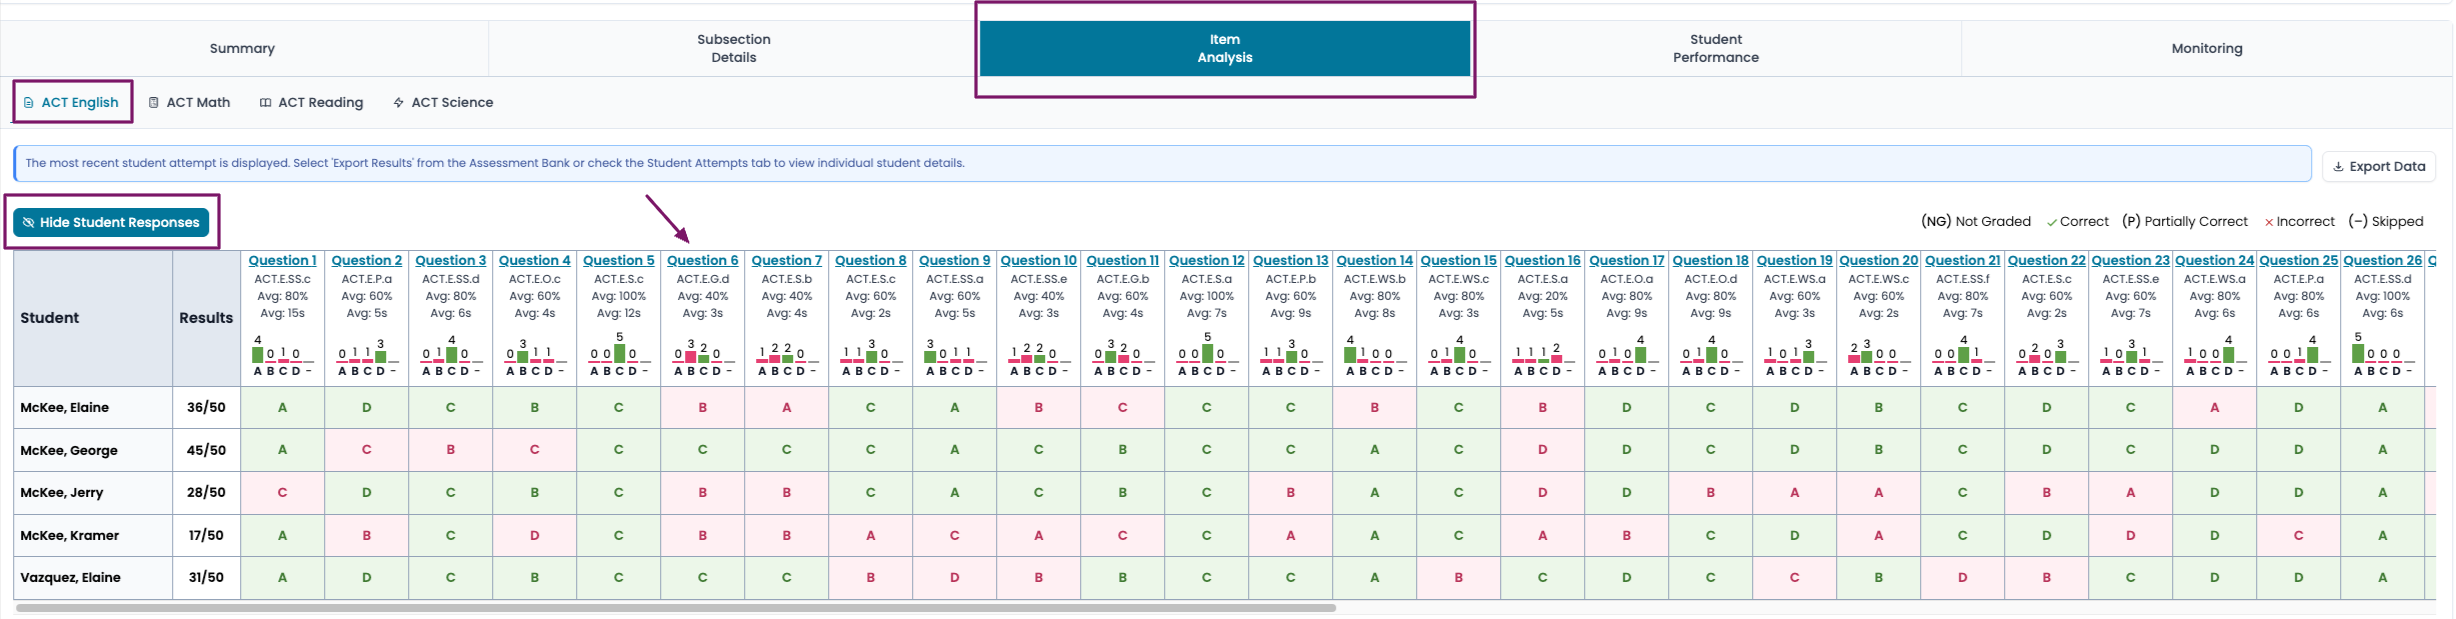
Click on the Question number to see a more detailed view of the question, the answer distribution, and student responses. Make use of the Hide Student Responses and the Show Answers button to reveal appropriate information when reviewing items in a group setting.
- Student Performance - Provides an individual student snapshot of performance in scaled score language. Use the Search function to quickly locate an individual student. Additional information about the individual student’s performance can be found on the students Score Report.
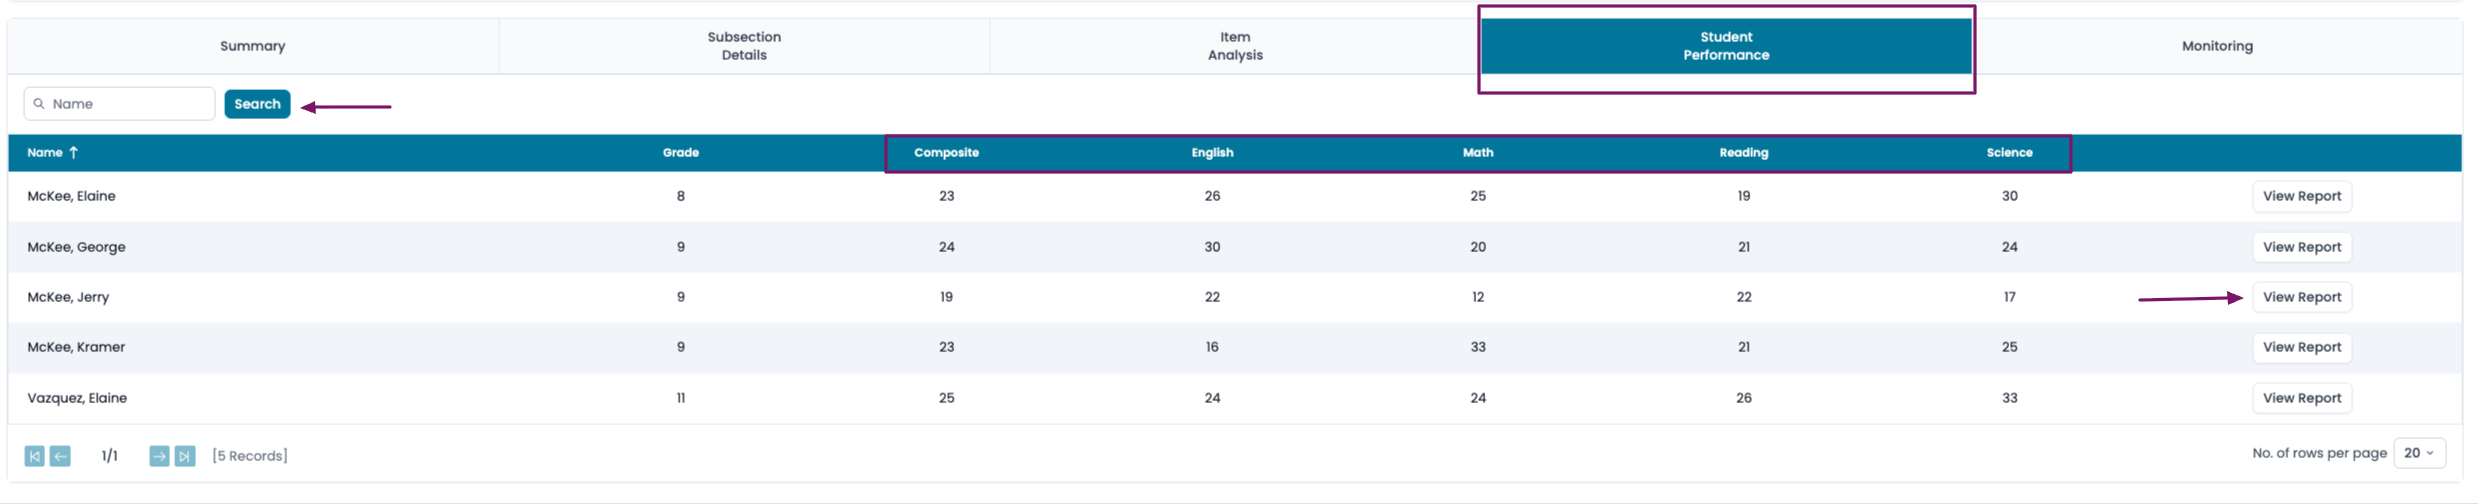
The student score report is organized in three tabs: Summary, Subsection Details, and Question and Answers. **Note that some or all of this information can be withheld from the student until the assignment due date when the assignment is set up. See Advanced Settings for additional information**
- Monitoring Page - Provides you with a list of students who have been assigned, not assigned, or completed each section of the assessment. Click the arrows to sort by category, then on View Report to see a specific student's report, or on the trash can icon to reset a student's attempt for each specific section of the test.

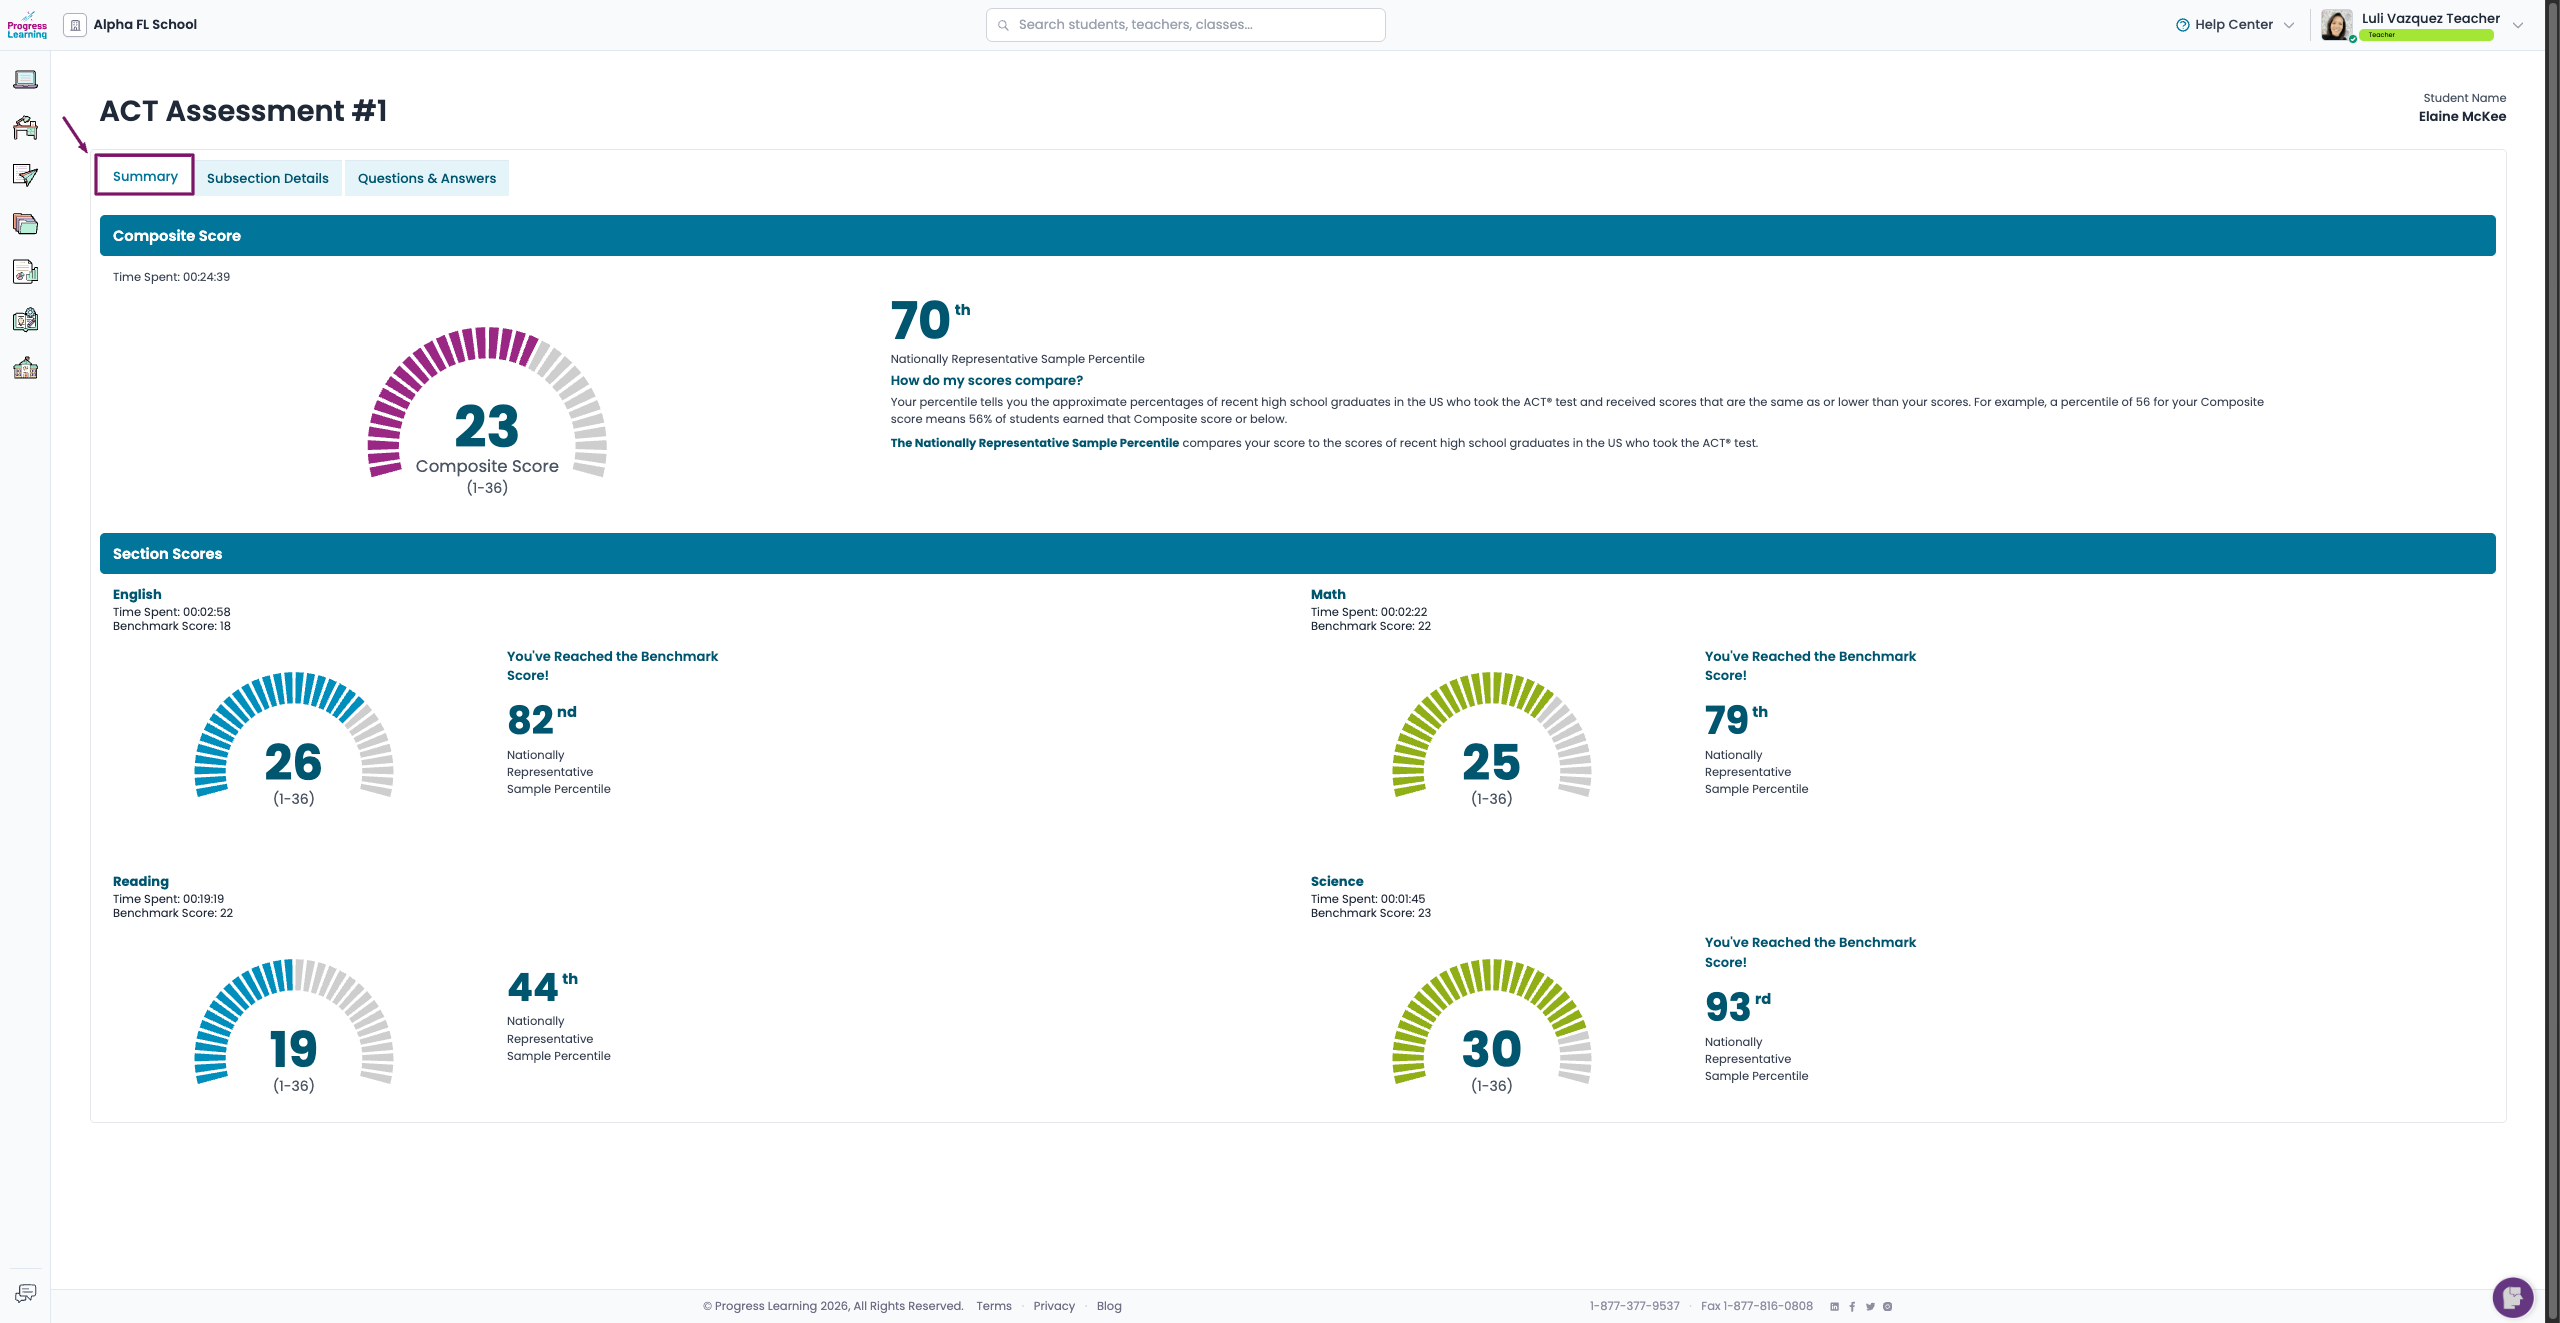
Student Score Report
- Summary Page - Provides student score information in Scaled Score language.
- Subsection Details - Provides student information at the topic/subsection level. Assessment sections (subjects) are organized by tabs. Students can also preview item-level information by expanding any topic and clicking on the item.
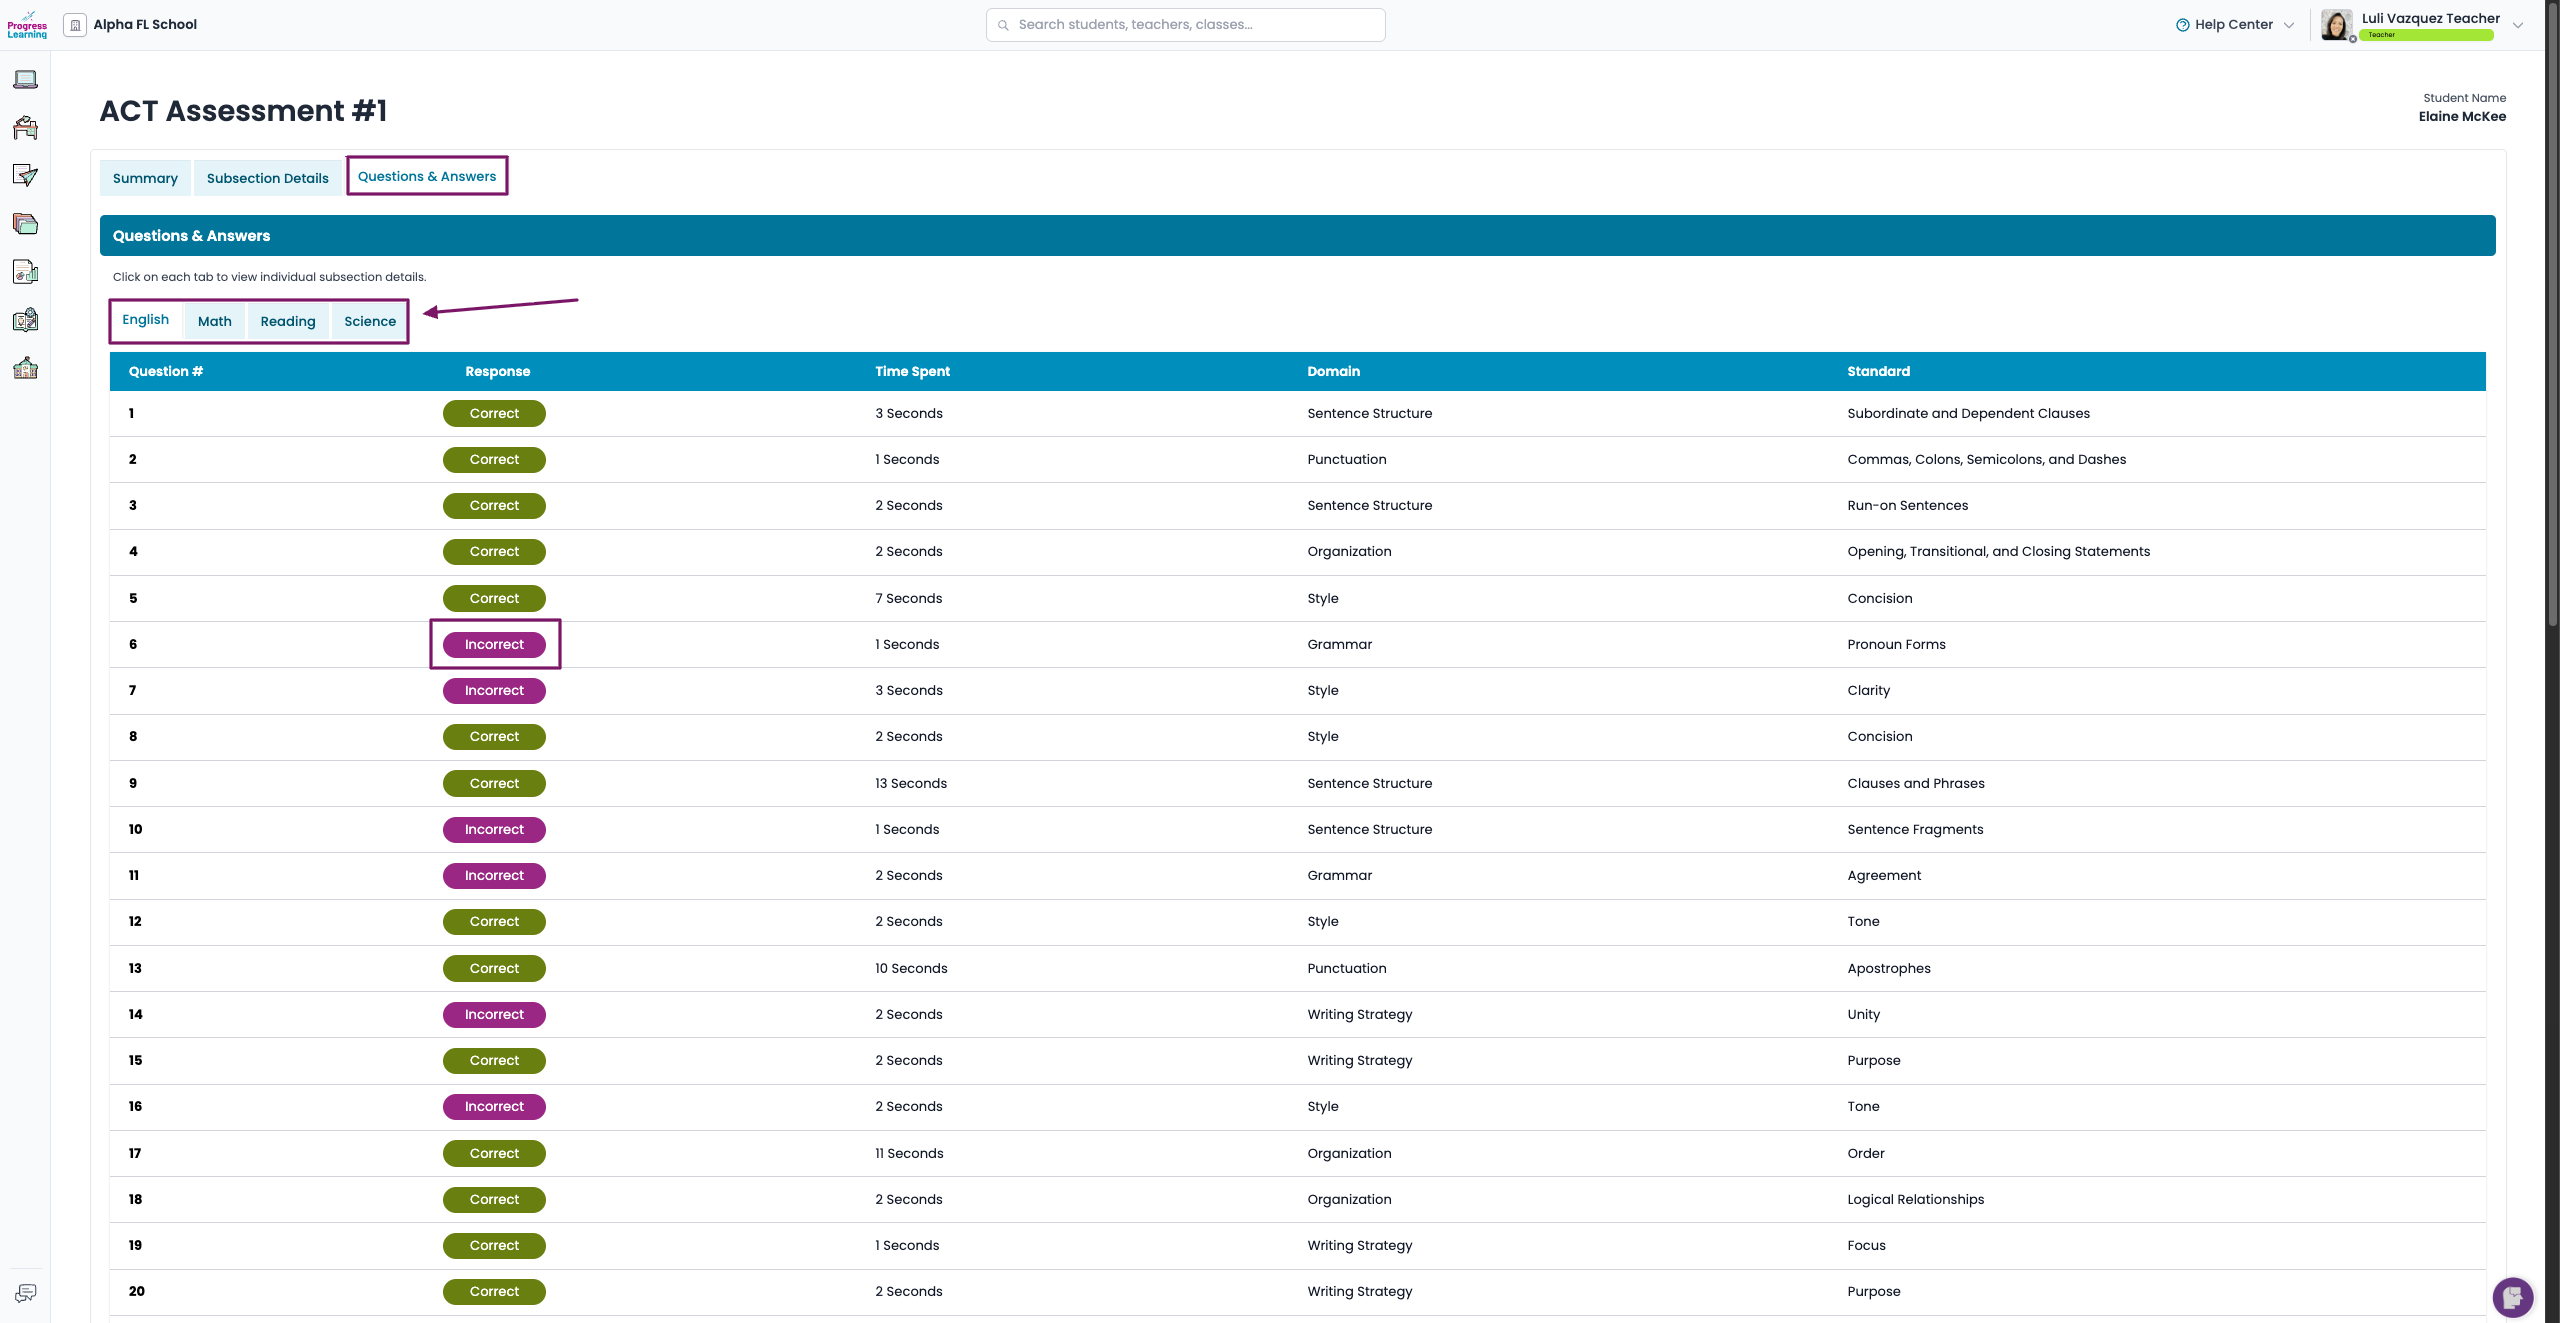
- Question and Answers - Provides an item-by-item review of student performance, including time spent per item. Assessment sections (subjects) are organized by tabs. Students can click on any item to see a preview of the item, including the student’s answer and the correct answer marked.
SAT®, PSAT 8/9®, PSAT 10/NMSQT®, Advanced Placement®, and AP®, are trademarks registered by the College Board, which was not involved with the creation of, is not affiliated with, and does not endorse services provided by progresslearning.com. ACT® and PreACT® are trademarks registered by ACT, which was not involved with the creation of, is not affiliated with, and does not endorse services provided by progresslearning.com. A Progress Learning assessment score is intended to approximate performance on the ACT®, it may not reflect the same score. Progress Learning is not affiliated with ACT, Inc. and does not have access to ACT’s proprietary data.